Time-varying Plasmapause and Electron data - April 2001
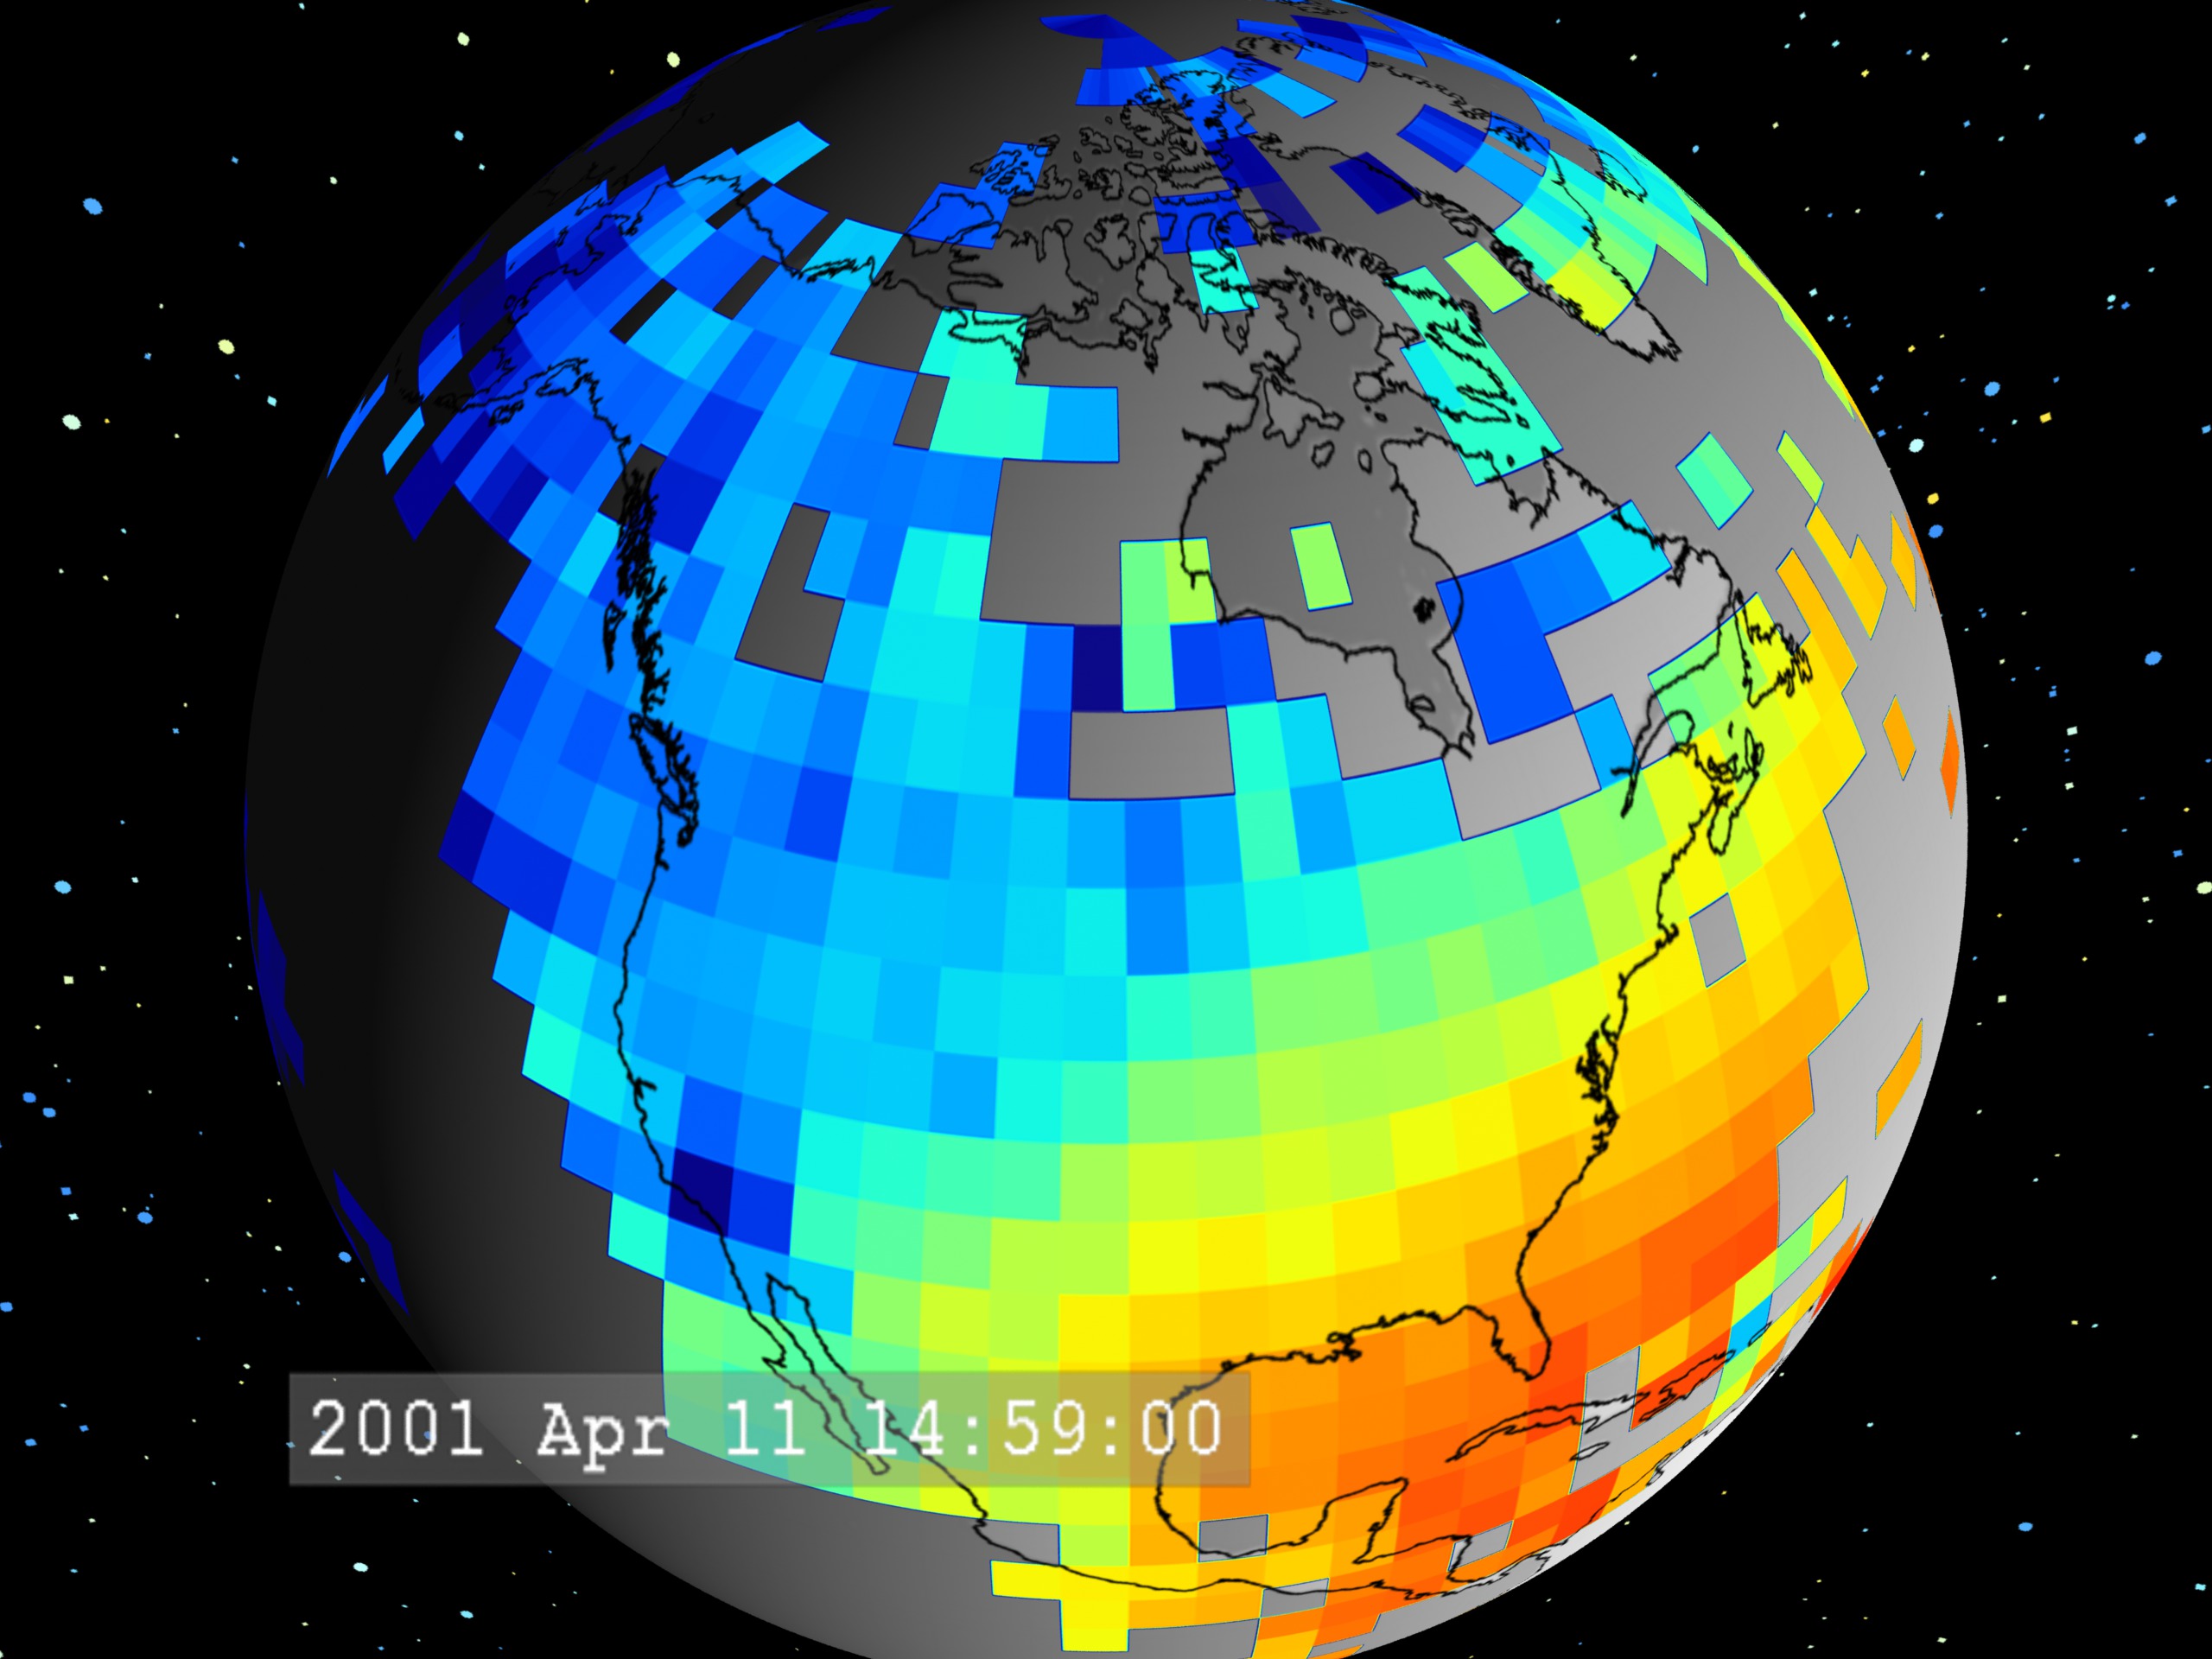
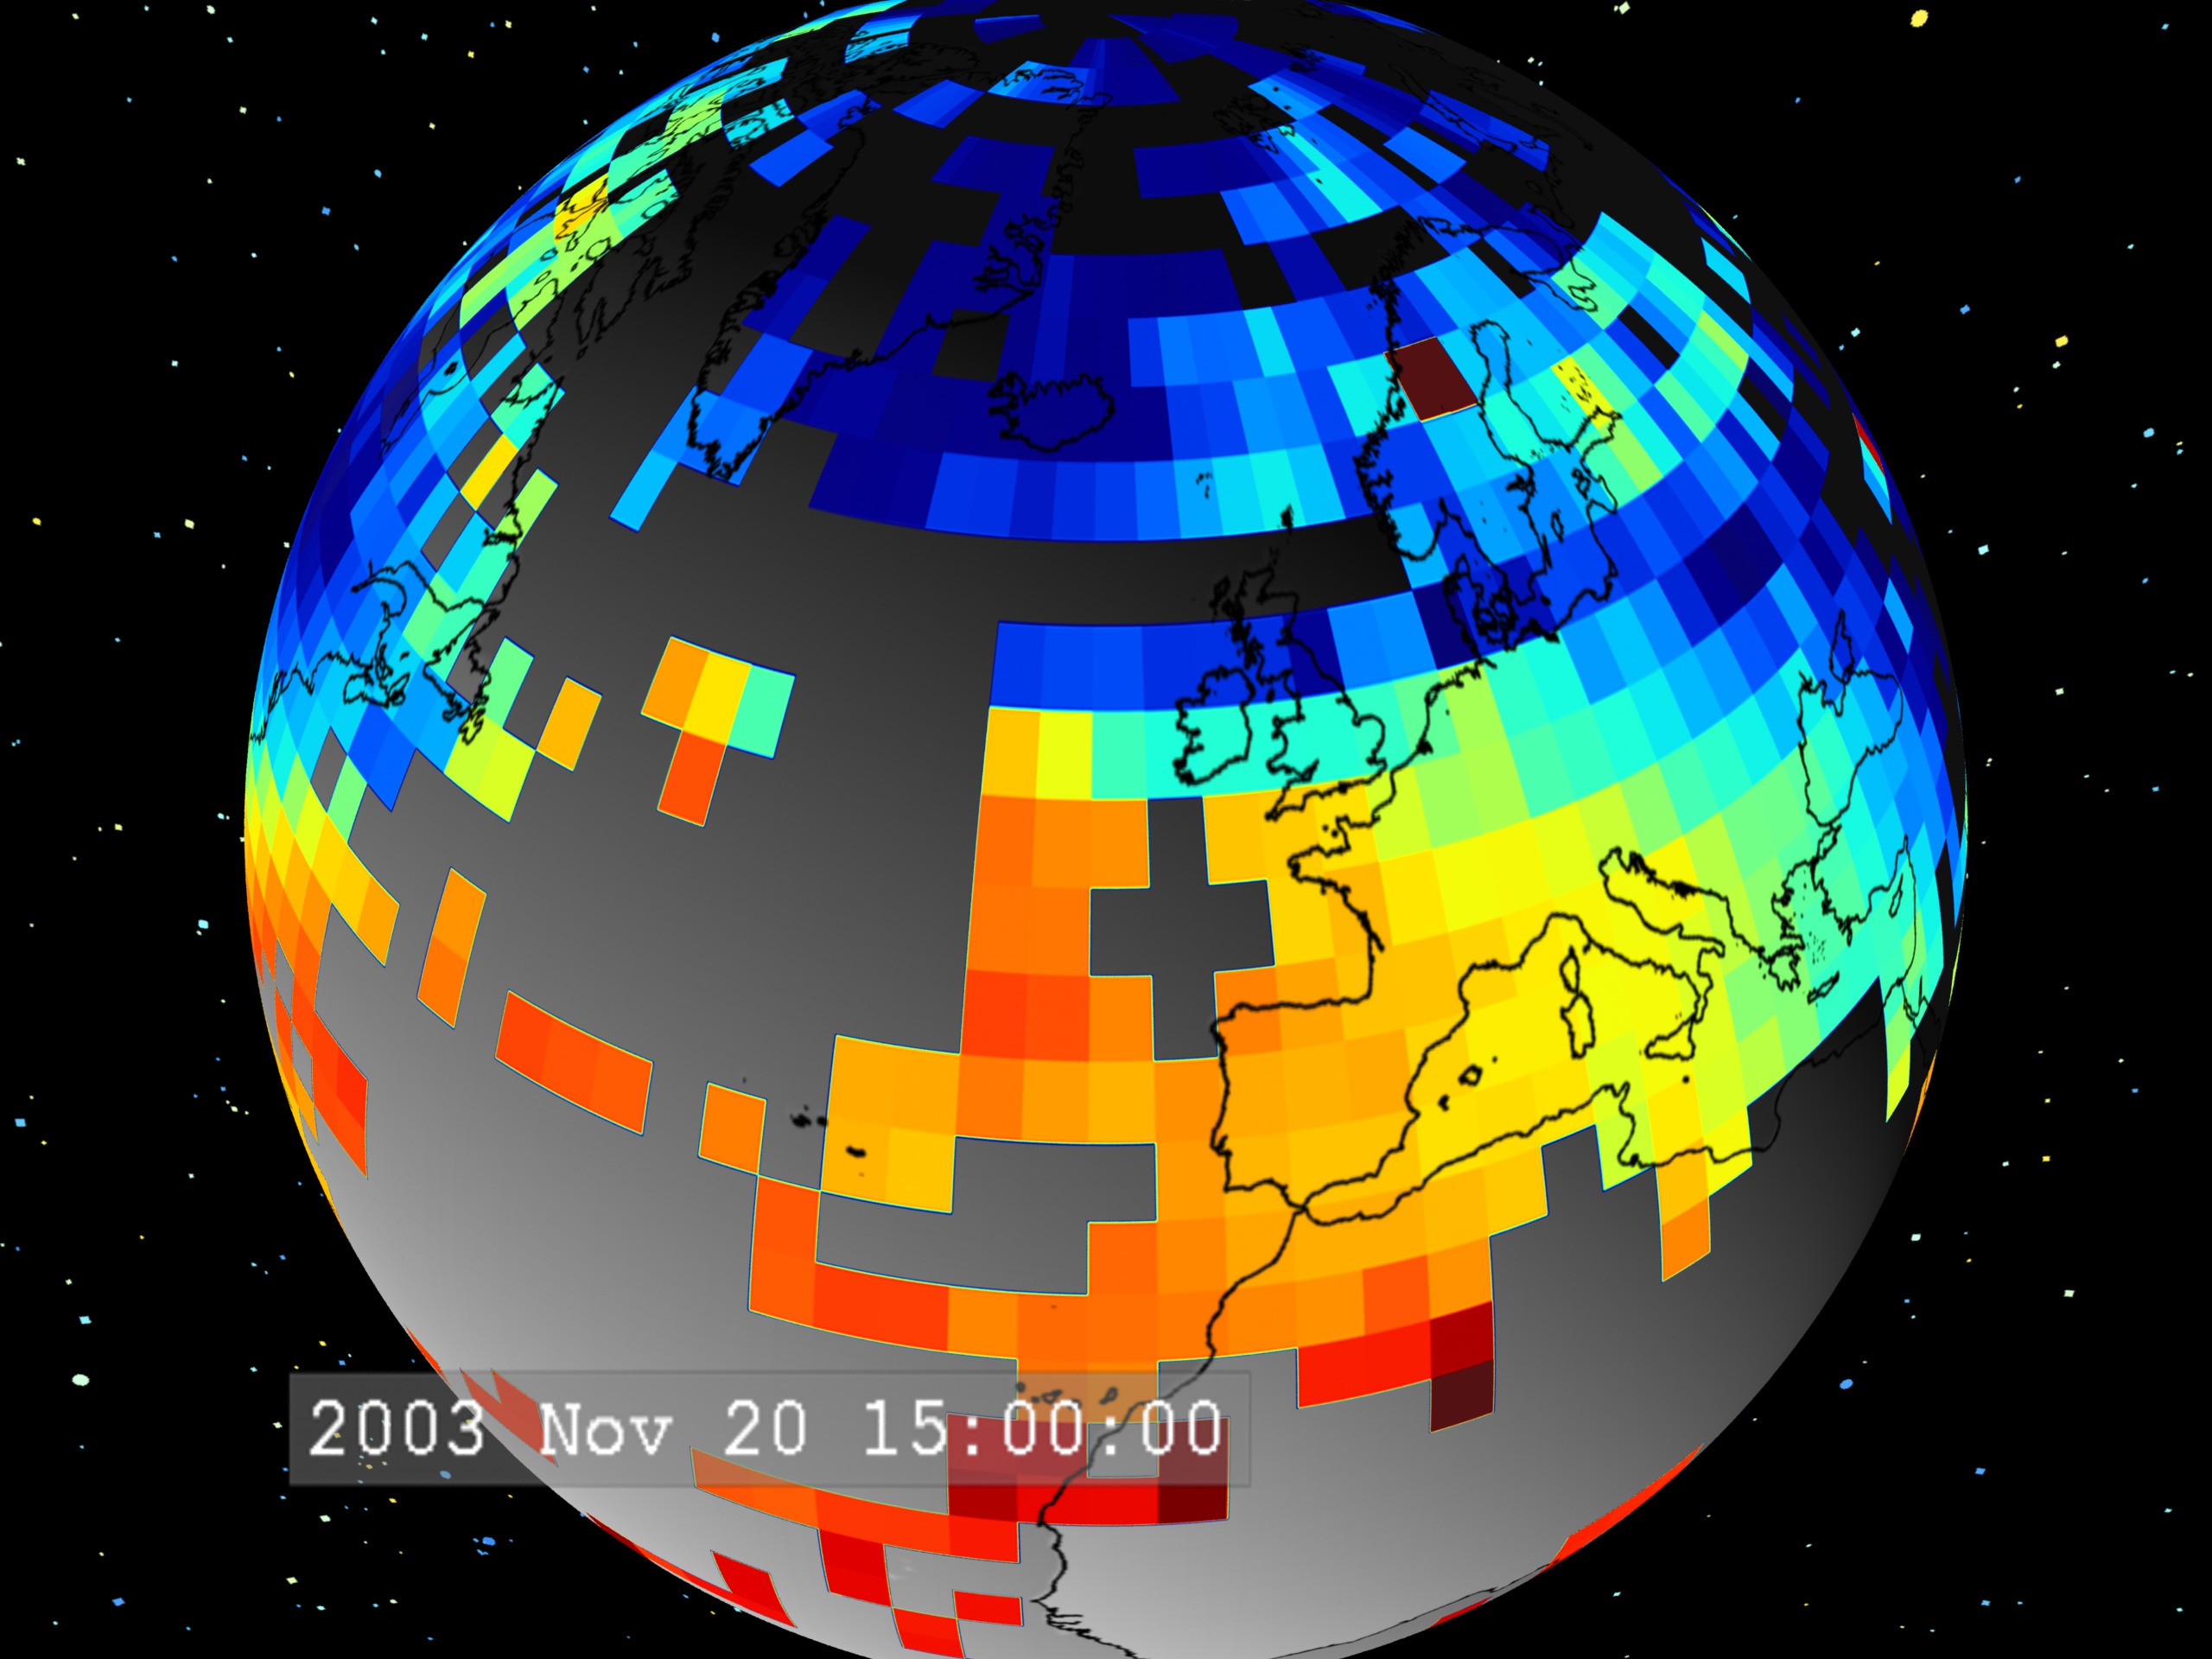
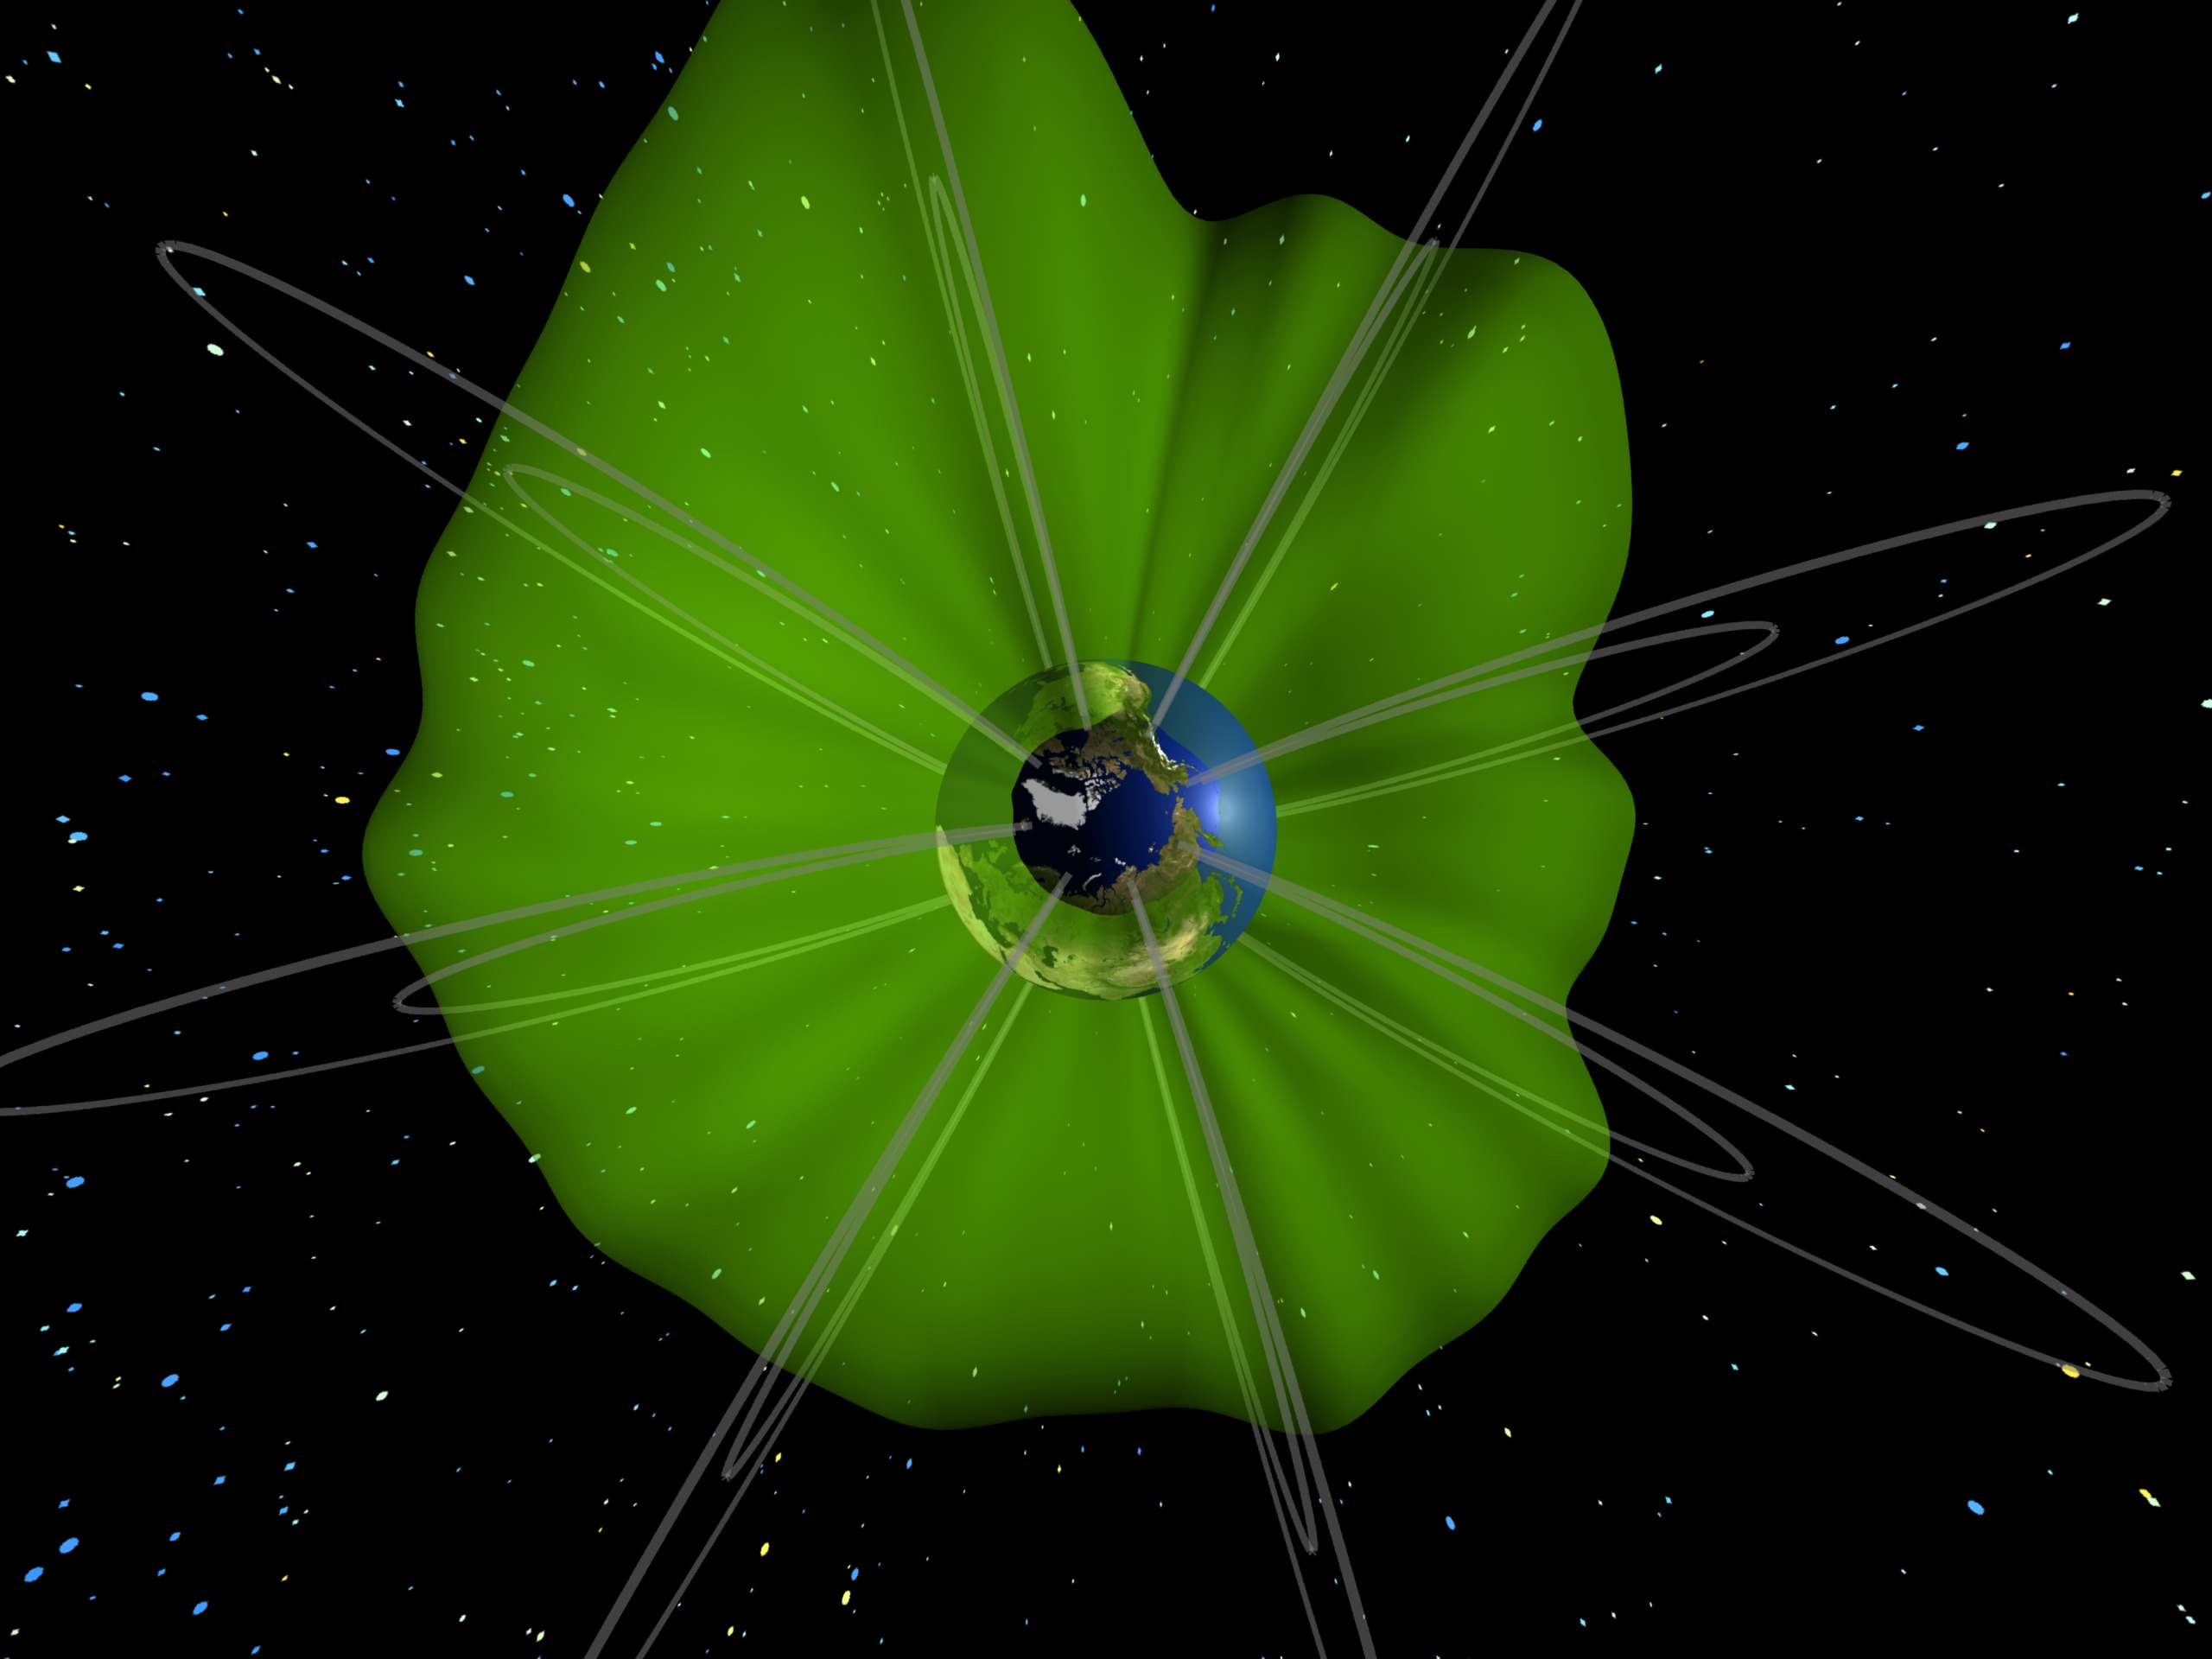
This is another view of the plasmapause and electron content data for the April 11, 2001 time frame (similar to ID 3312). This point of view is shifted slightly to the sunlit side of the Earth to present a better view of the plume formation.
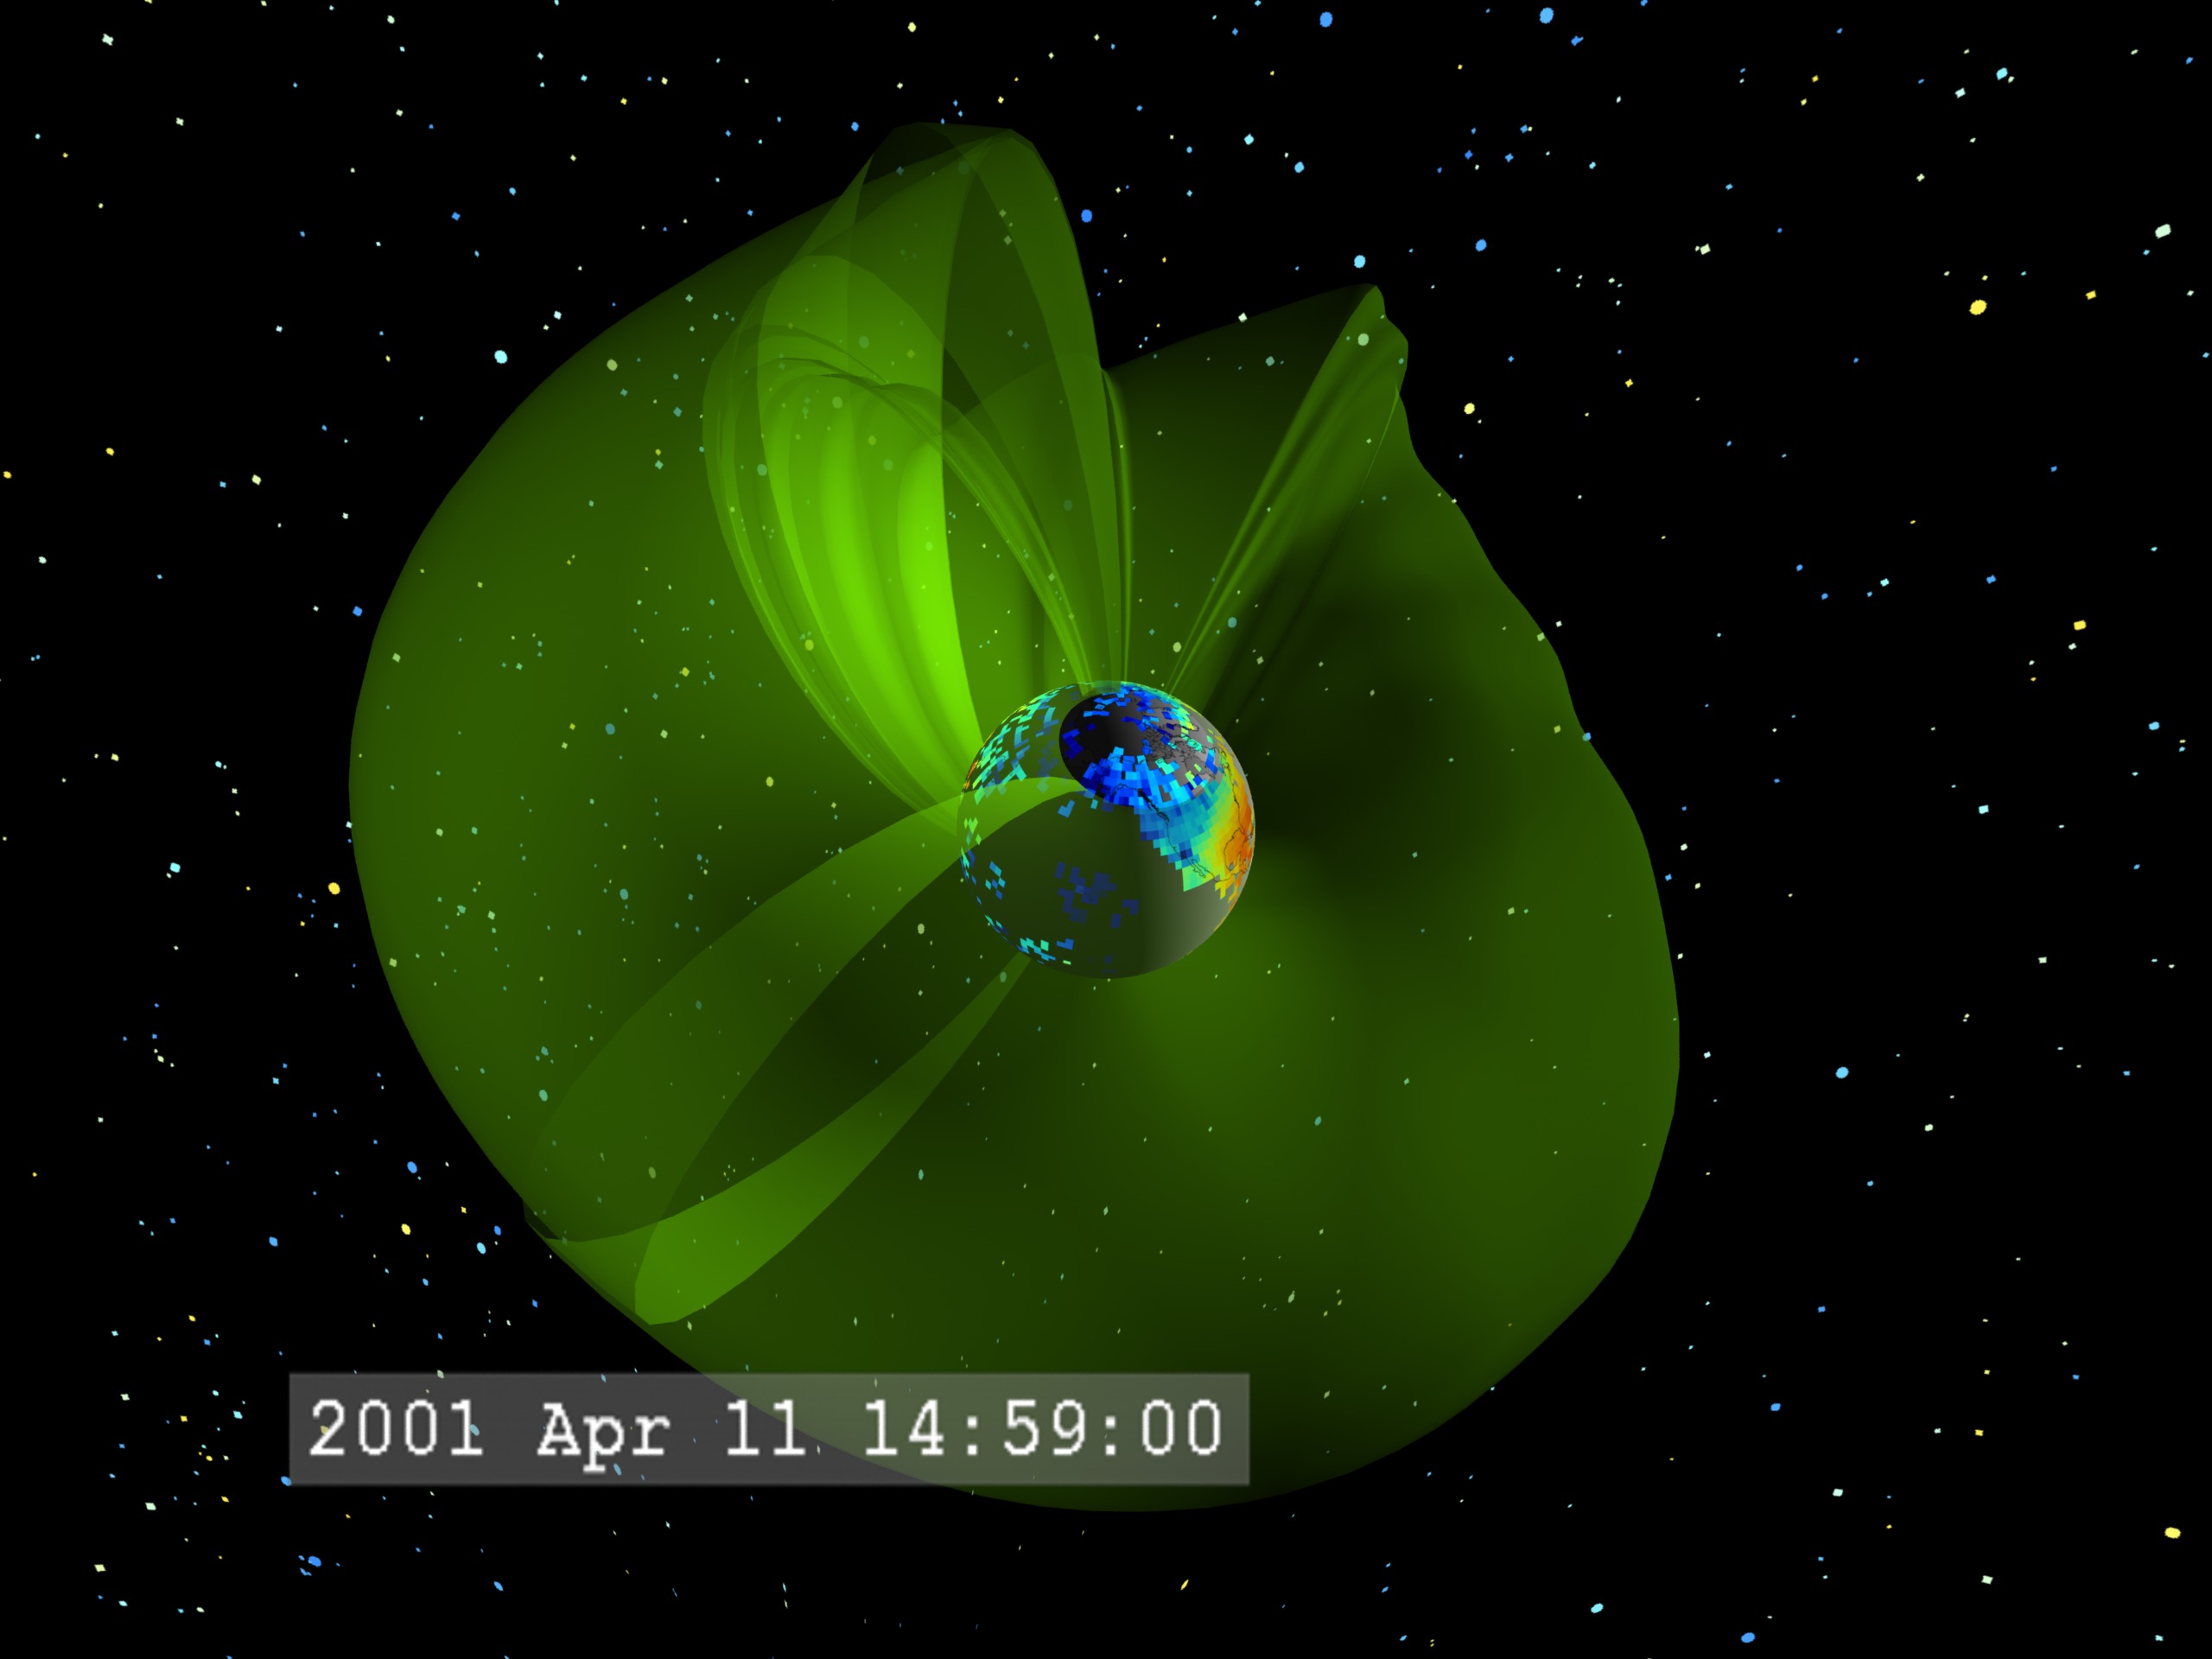
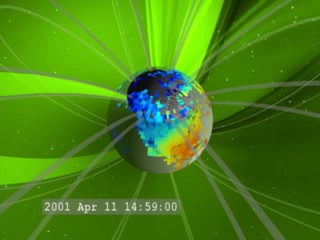
Animation of plasmasphere plume formation.
Animation of plasmasphere plume formation (without dates).

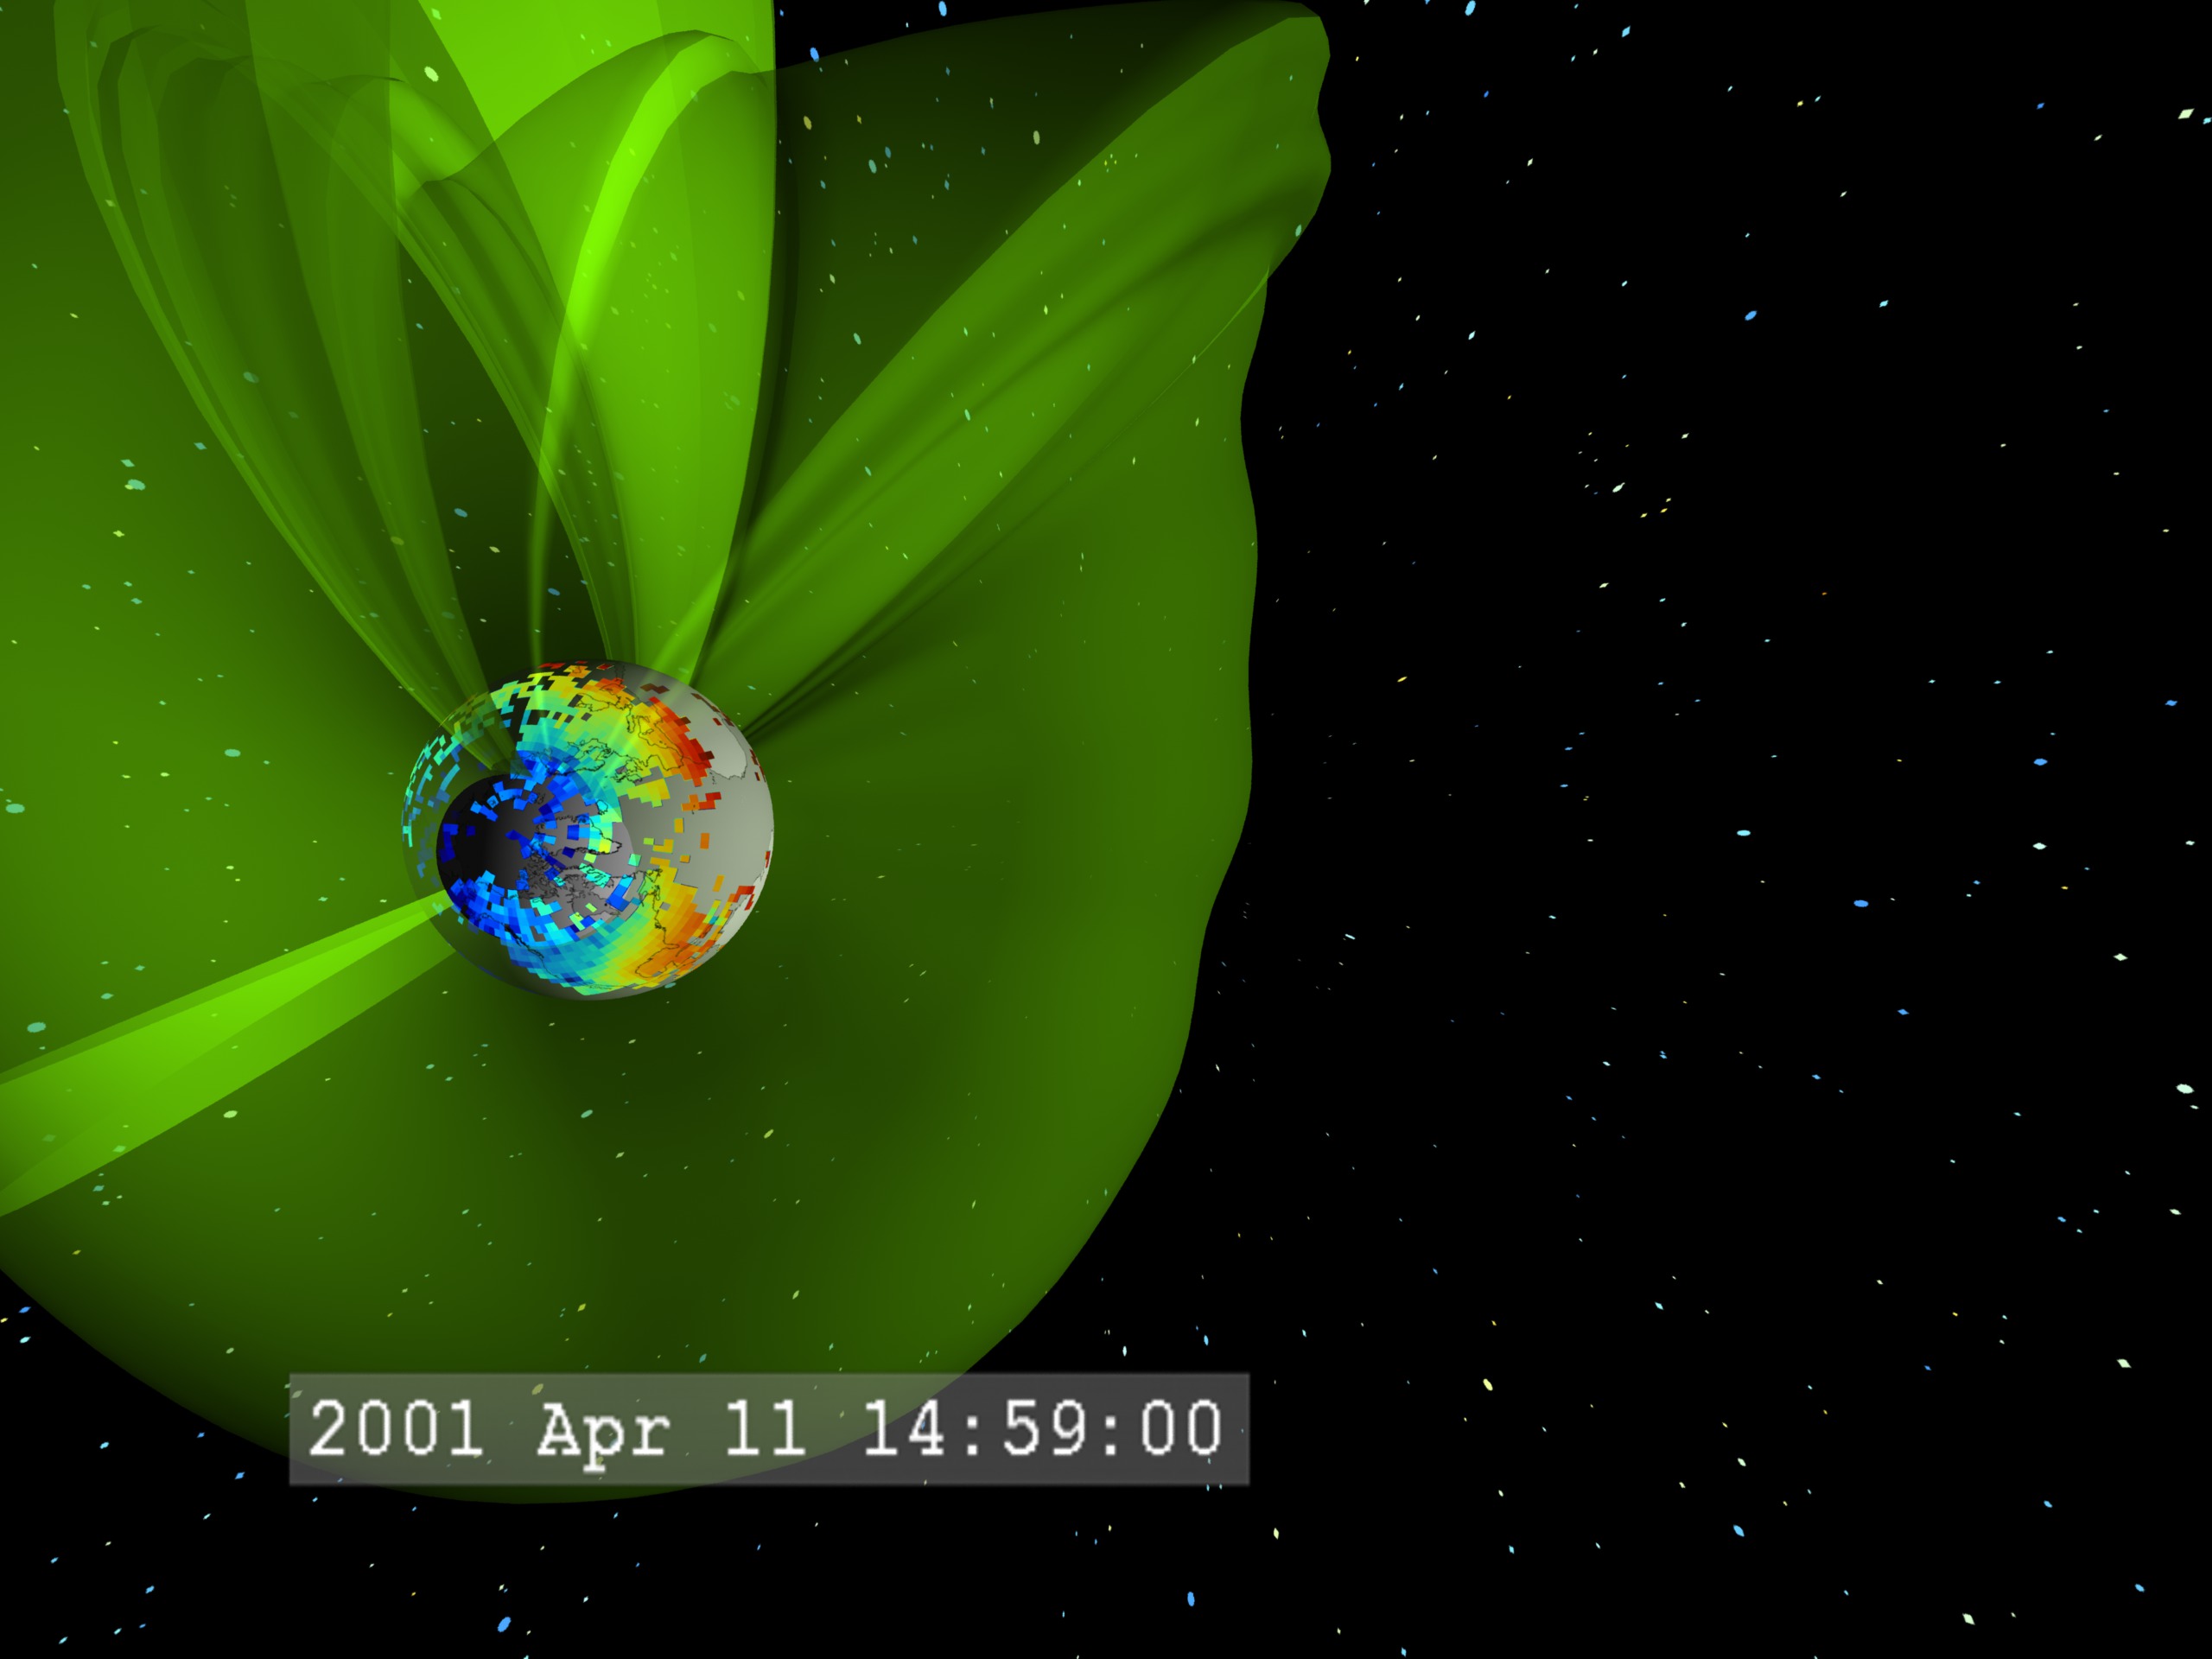
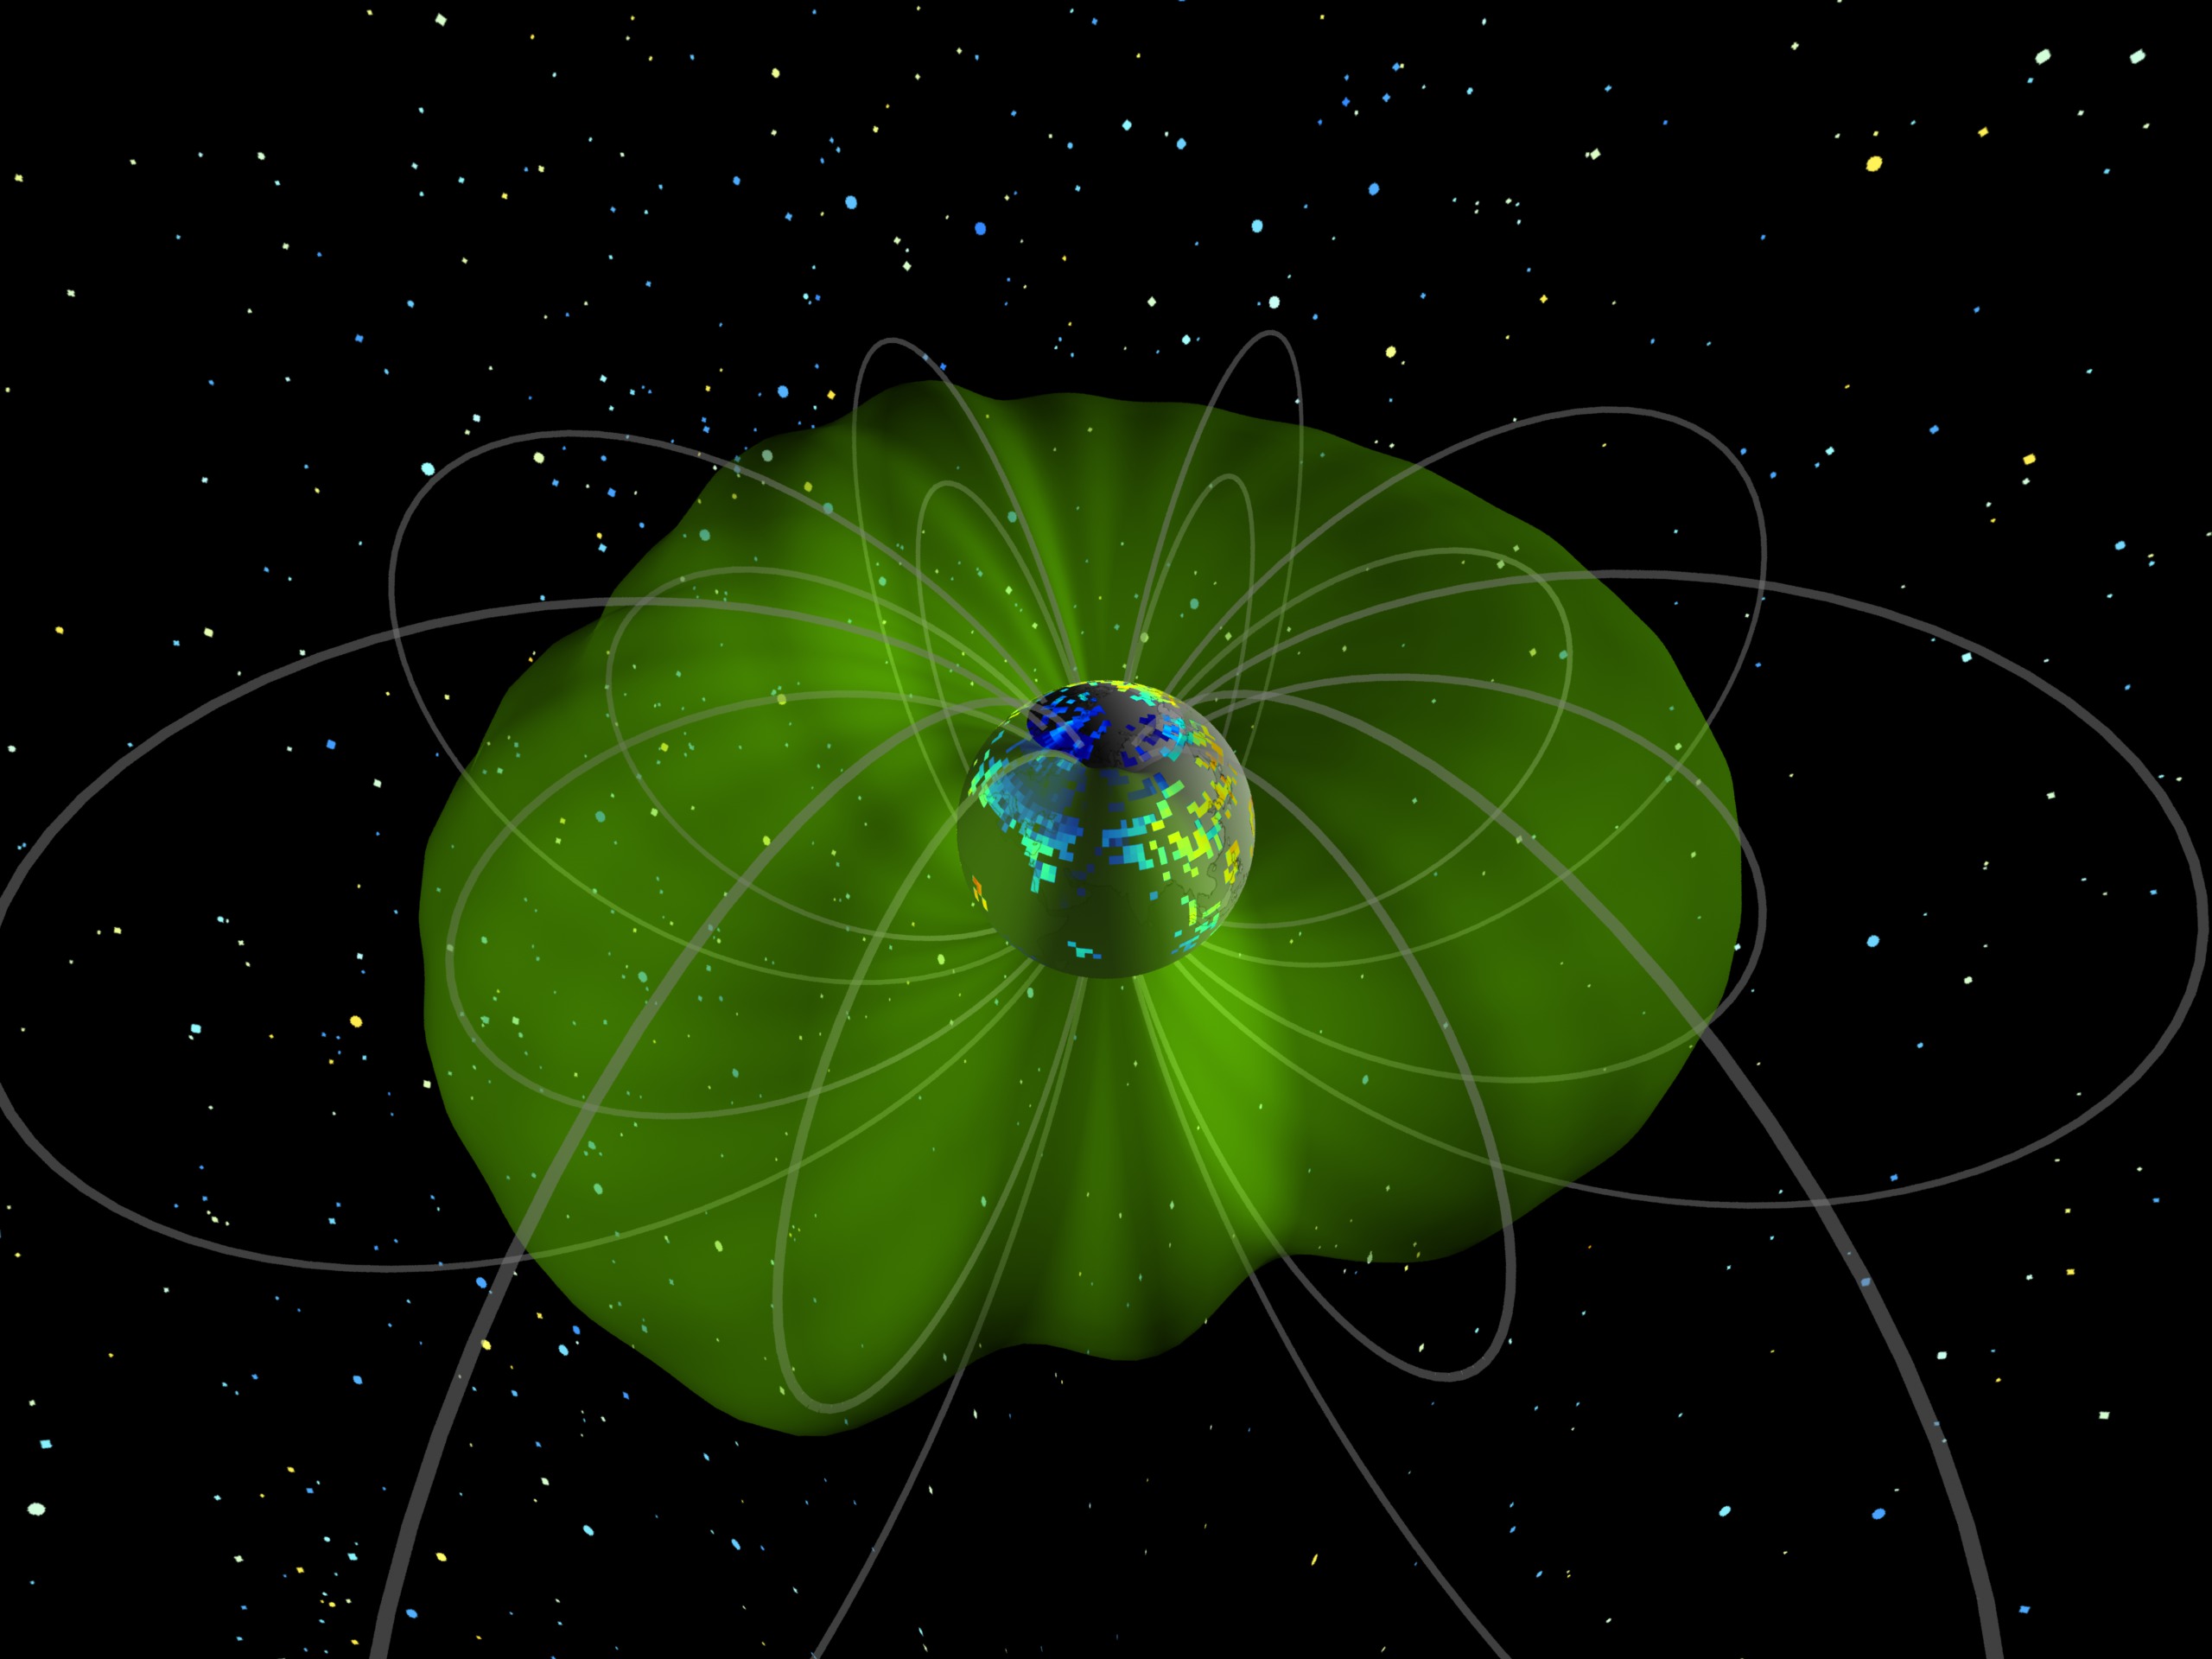
Early stage of the plasmasphere response.
Plasmasphere plume extending along the Earth's geomagnetic field lines.
For More Information
Credits
Please give credit for this item to:
NASA/Goddard Space Flight Center Scientific Visualization Studio
-
Animator
- Tom Bridgman (Global Science and Technology, Inc.)
-
Scientists
- Jerald Goldstein (SwRI)
- Marlene Colerico (MIT/Haystack)
- Anthea J. Coster (MIT/Haystack)
- John Foster (MIT/Haystack)
Missions
This page is related to the following missions:Series
This page can be found in the following series:Related papers
JOURNAL OF GEOPHYSICAL RESEARCH, VOL. 110, A09S31, doi:10.1029/2004JA010928, 2005
JOURNAL OF GEOPHYSICAL RESEARCH, VOL. 110, A09S31, doi:10.1029/2004JA010928, 2005
Datasets used
-
[IMAGE: EUV]
ID: 41 -
Total Electron Content (TEC) [NAVSTAR: World-wide GPS Receiver Network]
ID: 580This dataset can be found at: http://www.navcen.uscg.gov/GPS/geninfo/
See all pages that use this dataset
Note: While we identify the data sets used on this page, we do not store any further details, nor the data sets themselves on our site.
Related
- ID: 3310
 Visualization
 - ID: 3311

- ID: 3312
- ID: 3313
 Visualization
 - ID: 3314
 Visualization
 - ID: 3315
 Visualization
 - ID: 3316
- ID: 3317
Release date
This page was originally published on Monday, December 5, 2005.
This page was last updated on Wednesday, May 3, 2023 at 1:55 PM EDT.