X-Ray Images of the North Polar Region (WMS)
Here are X-rays images (shown on the same brightness scale) of the north polar region obtained by Chandra HRC-I on different days, showing large variability in soft (0.1-10.0 keV) X-ray emissions from Earth s aurora. Note that the images are not snap shots, but are approximately 20-min scans of the northern auroral region in the HRC-I field-of-view. The brightness scale in Rayleighs (R) assumes an average effective area of 40 cm2. The day-night terminator at an altitude of 0 km is displayed with lighting. The day-night terminator at an altitude of 100 km is shown by the blue line.
X-ray emissions from Earth's aurora.
This product is available through our Web Map Service.
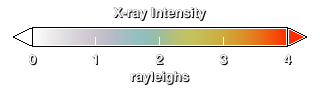
X-ray emissions colortable
Credits
Please give credit for this item to:
NASA/Goddard Space Flight Center
Scientific Visualization Studio
-
Animators
- Lori Perkins (NASA/GSFC)
- Eric Sokolowsky (Global Science and Technology, Inc.)
-
Scientists
- Anil Bhardwaj (NASA/MSFC)
- Ron Elsner (NASA/MSFC)
- Randy Gladstone (SwRI)
- Megan Watzke (Harvard)
Release date
This page was originally published on Wednesday, June 1, 2005.
This page was last updated on Wednesday, May 3, 2023 at 1:56 PM EDT.
Series
This visualization can be found in the following series:Datasets used in this visualization
-
[Chandra: HRC-I]
ID: 164
Note: While we identify the data sets used in these visualizations, we do not store any further details, nor the data sets themselves on our site.