Urban Signatures: Evaporation (WMS)
Big cities influence the environment around them. For example, urban areas are typically warmer than their surroundings. Cities are strikingly visible in computer models that simulate the Earth's land surface. This visualization shows evaporation rates predicted by the Land Information System (LIS) for a day in June 2001. Evaporation is lower in the cities because water tends to run off pavement and into drains, rather than being absorbed by soil and plants from which it later evaporates. Only part of the global computation is shown, focusing on the highly urbanized northeast corridor in the United States, including the cities of Boston, New York, Philadelphia, Baltimore, and Washington.

This image shows evaporation rate (milligrams
per square meter per second) predicted by LIS for 2001/06/11.
The urban areas stand out very distinctly against their
more evaporative surroundings.
This product is available through our Web Map Service.
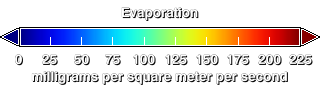
Evaporation color bar, with scale ranging from 0 to 225 mg/m2/sec.
Credits
Please give credit for this item to:
NASA/Goddard Space Flight Center
Scientific Visualization Studio. Additional credit should go to NASA GSFC Land Information System (http://lis.gsfc.nasa.gov/)
-
Animator
- Jeff de La Beaujardiere (NASA)
Release date
This page was originally published on Friday, May 27, 2005.
This page was last updated on Wednesday, May 3, 2023 at 1:56 PM EDT.
Series
This visualization can be found in the following series:Datasets used in this visualization
-
Evaporation [LIS]
ID: 396
Note: While we identify the data sets used in these visualizations, we do not store any further details, nor the data sets themselves on our site.