Rainfall Accumulation from Hurricane Isabel (WMS)
Hurricane Isabel generated large amounts of rain over the Atlantic ocean as it approached East coast of the United States in September 2003. In fact, unlike many hurricanes, most of the Isabel's rainfall did not occur over land; flooding on land was caused mainly by storm surge. This animation shows accumulation of rainfall from the hurricane—each frame shows the total amount of rain since the start of the measurement period. Rain from other sources has been masked out, so the hurricane track is clearly visible as the storm moves across the Atlantic.
Animation of Hurricane Isabel rainfall
accumulation from September 6 through 19, 2003. Frames were
taken every 3 hours starting at 00:00UT on 2003-09-06. Each
pixel covers 0.25deg of longitude and latitude; the total area shown
is 80x40 degrees.
This product is available through our Web Map Service.
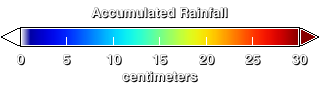
Color scale for accumulated rainfall map, ranging from deep blue (less than 5cm) up to deep red (30cm or more).
Credits
Please give credit for this item to:
NASA/Goddard Space Flight Center
Scientific Visualization Studio
-
Animator
- Jeff de La Beaujardiere (NASA)
-
Scientist
- Robert Adler (NASA/GSFC)
Release date
This page was originally published on Tuesday, April 19, 2005.
This page was last updated on Wednesday, May 3, 2023 at 1:56 PM EDT.
Missions
This visualization is related to the following missions:Series
This visualization can be found in the following series:Datasets used in this visualization
-
Rainfall Accumulation [TRMM: TMI]
ID: 521This dataset can be found at: http://disc.sci.gsfc.nasa.gov/data/datapool/TRMM/01_Data_Products/index.html
See all pages that use this dataset
Note: While we identify the data sets used in these visualizations, we do not store any further details, nor the data sets themselves on our site.