Daily Sea Ice Surface Temperature 2002-2003 (WMS)
This animation shows the daily sea ice surface temperature over the northern hemisphere from September 2002 through May 2003. The sea ice surface temperature was measured by the MODIS instrument on the Aqua satellite. Since this instrument cannot take measurements through clouds or in the dark, in dark or cloud-covered regions or areas with suspect data quality, the prior day's value is retained until a valid data reading is obtained. The color of the sea ice indicates the sea ice surface temperature.
This animation shows the temperature of the sea ice near the north pole in 2002-2003.
This product is available through our Web Map Service.
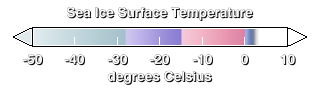
This color bar shows the colors used to represent the sea ice surface temperature. The coldest water is shown in light blue. The warmest sea ice is shown in shades of pink. As the sea ice surface temperatures cool below -15 degrees Celsius, the color is shown in shades of purple. The sea ice surface below -28 degrees Celsius is shown in shades of blue and grey.
Credits
Please give credit for this item to:
NASA/Goddard Space Flight Center
Scientific Visualization Studio
-
Visualizer
- Cindy Starr (Global Science and Technology, Inc.)
-
Animator
- Eric Sokolowsky (Global Science and Technology, Inc.)
-
Scientist
- George Riggs (SSAI)
Release date
This page was originally published on Wednesday, January 12, 2005.
This page was last updated on Wednesday, May 3, 2023 at 1:56 PM EDT.
Missions
This visualization is related to the following missions:Series
This visualization can be found in the following series:Datasets used in this visualization
-
[Terra: MODIS]
ID: 116 -
Sea Ice Extent and Ice Surface Temperature Daily L3 Global 4km EASE-Grid Day (MYD29E1D) [Aqua: MODIS]
ID: 253This dataset can be found at: http://nsidc.org/data/myd29e1d.html
See all pages that use this dataset
Note: While we identify the data sets used in these visualizations, we do not store any further details, nor the data sets themselves on our site.