Global Sea Surface Temperature from June, 2002 to September, 2003 (WMS)
The temperature of the surface of the world's oceans provides a clear indication of the state of the Earth's climate and weather. The AMSR-E instrument on the Aqua satellite measures the temperature of the top 1 millimeter of the ocean every day, even through the clouds. In this visualization sequence covering the period from June, 2002, to September, 2003, the most obvious effects are the north-south movement of warm regions across the equator due to the seasonal movement of the sun and the seasonal advance and retreat of the sea ice near the North and South poles. It is also possible to see the Gulf Stream, the warm river of water that parallels the east coast of the United States before heading towards northern Europe, in this data. Around January 1, 2003, a cooler than normal region of the ocean appears just to the west of Peru as part of a La Niña and flows westward, driven by the trade winds. The waves that appear on the edges of this cooler area are called tropical instability waves and can also be seen in the equatorial Atlantic Ocean about the same time.
The oceans of the world are falsely colored in this animation. The warmest temperatures are shown in bright yellow and the coldest temperatures are shown in dark green and black. Grey represents areas that have no data values such as coastal regions or land. White represents surface ice.
This product is available through our Web Map Service.
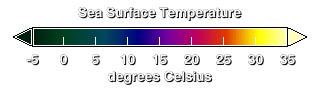
Colorbar for sea surface temperature. Temperatures are given in degrees Celsius.
For More Information
Credits
Please give credit for this item to:
NASA/Goddard Space Flight Center
Scientific Visualization Studio
-
Animators
- Eric Sokolowsky (Global Science and Technology, Inc.)
- Greg Shirah (NASA/GSFC)
- Jesse Allen (Raytheon)
-
Scientists
- Frank J. Wentz (Remote Sensing Systems)
- Chelle Gentemann (Remote Sensing Systems)
Release date
This page was originally published on Thursday, February 12, 2004.
This page was last updated on Sunday, November 12, 2023 at 10:00 PM EST.
Series
This visualization can be found in the following series:Datasets used in this visualization
-
[Aqua: AMSR-E]
ID: 4For more information, please click http://wwwghcc.msfc.nasa.gov/AMSR/
See all pages that use this dataset
Note: While we identify the data sets used in these visualizations, we do not store any further details, nor the data sets themselves on our site.