Phytoplankton in Northern Oceans Have Declined From 1980s Levels
Phytoplankton Press Release
Introduction
A check up of the Earth's planetary health reveals that the lowest rung in the ocean food chain is shrinking. For the past 20 years (early 1980s to present), phytoplankton concentrations declined as much as 30 percent in northern oceans. Scientists from NASA and the National Oceanic and Atmospheric Administration (NOAA) say warmer ocean temperatures and low winds may be depriving the tiny ocean plants of necessary nutrients. However, they still do not know if the loss of phytoplankton is a long-term trend or a climate oscillation.
Earth's Checkup
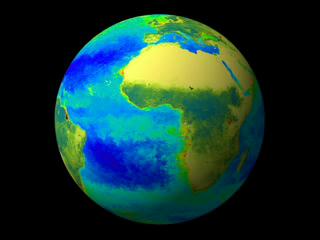
Scientist can monitor ocean and planetary health through phytoplankton. Since the whole ocean food chain depends on the health and productivity of phytoplankton, a significant change could indicate a shift in our climate. Phytoplankton consists of many diverse species of microscopic free-floating ocean plants that form the base of the ocean's food chain. These plants thrive on sunlight and nutrients. Limit either one and phytoplankton will not grow. This image from the SeaWiFS instrument on board the Orbview-2 satellite shows the green clouds of phytoplankton pulsating around the globe. Yellows and reds represent high concentrations of phytoplankton.
Summer Phytoplankton Around the World
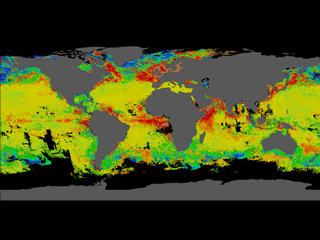
Phytoplankton concentrations have declined substantially in northern oceans since the early 1980s. This world map compares satellite data collected during the summer(July-September) between 1979 and 1986 and 1997 to 2000 and reflects the changes in phytoplankton concentrations over the last 20 years in the open ocean (away from the coast). Deep blues show the greatest loss of phytoplankton, yellow represents almost no change and browns, reds and oranges show phytoplankton increases. Black indicates that no data is available.
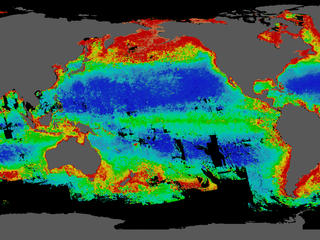
Summer Phytoplankton in the North Pacific
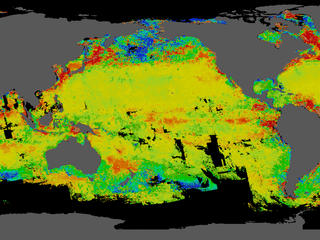
The largest phytoplankton decline was in the North Pacific where concentrations have dropped by 30 percent since the 1980s. This image shows a close-up of the north Pacific. While there is some red in this image representing a slight increase in phytoplankton, it is not enough to make up for large decreases in the blue areas. The data was collected in the summers (July-September) from 1979-2000.
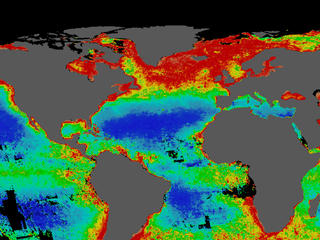
Summer Phytoplankton in the North Atlantic
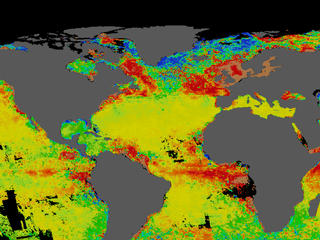
In the North Atlantic, phytoplankton concentrations have dropped by 14 percent since the 1980s. Like the North Pacific, there is a lot of red representing a slight increase in phytoplankton but it does not make up for the large decreases shown in blue. The data was collected in the summers (July-September) from 1979-2000.
![]()
Color bar for Images 2-4
Click on bar to enlarge
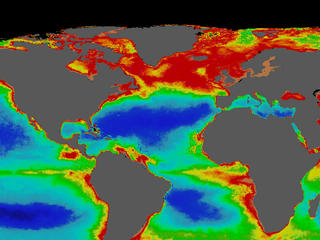
Summer Phytoplankton 1979 to 1986
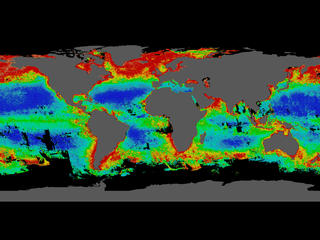
This image shows summer (July-September) phytoplankton concentrations from 1979 to 1986. This data set was collected by the Coastal Zone Color Scanner (CZCS) on board the Nimbus 7 spacecraft with additional sampling from ships and buoys in the ocean. CZCS is a predecessor to SeaWiFS and was designed to monitor ocean color. Ocean color reflects varying concentrations of phytoplankton that absorb different levels of sunlight. Reds show high concentrations of phytoplankton, yellow represents medium concentrations, green is the next rung down and blue is low.
North Pacific Summer, 1979-1986 |
North Atlantic Summer, 1979-1986 |
Summer Phytoplankton 1997 to 2000
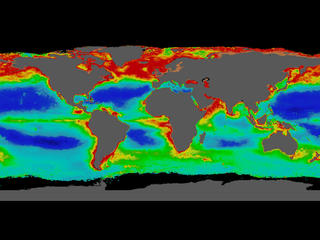
This image shows summer phytoplankton concentrations from Sea-viewing Wide Field-of-view Sensor's (SeaWiFS) launch in 1997 through 2000. SeaWiFS data is establishing a solid baseline for scientists to monitor the impact on phytoplankton of global climate change. Reds show high concentrations of phytoplankton, yellow represents medium concentrations, green is the next rung down and blue is low.
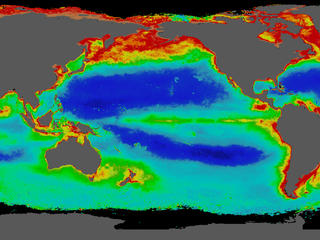
North Pacific Summer, 1997-2000 |
North Atlantic Summer, 1997-2000 |
![]()
Color bar for Images 5-6
Click on bar to enlarge
For more information on this page contact:
Rani Chohan
Goddard Space Flight Center
Greenbelt, MD 20771
301-286-2483
High Resolution of Image 2
High Resolution of Image 3
High Resolution of Image 4
High Resolution of Image 5
High Resolution of Image 6
High Resolution of North Pacific, Summer, 1979-1986, Taken by CZCS
High Resolution of North Atlantic, Summer 1979-1986, Taken by CZCS
High Resolution of North Pacific, Summer, 1997-2000, Taken by SeaWiFS
High Resolution of North Atlantic, Summer, 1997-2000, Taken by SeaWiFS