|
Exploring Earth from Space:
Dr. David Adamec, NASA/GSFC |
 |
| Thank you Marshall. Hasn't this been great? I've seen these visuals before and I still am wowed when I see them. I'm going to speak to you about the third piece of the climate puzzle, the oceans. Why are the oceans important to the earth's climate system? The answer is because of their enormous capacity to store heat. How much heat? The oceans on average are about 2 and a half miles deep, but there is as much heat in the upper six feet of the ocean as there is in the entire atmosphere! With this incredibly large storage capacity, it's no wonder that the oceans are the memory of the earth's climate system. |  View Movie: [0.6 MB QuickTime] [3.3 MB MPEG-1] |
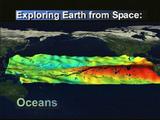
| You're looking at a representation of the global ocean with sea surface temperatures indicated by color and sea surface height by the bumps you see on the globe. I'll explain why sea surface height is so important later. As we move in time through spring 1997 we see a warm patch of water develop off the west coast of South America. This is El Niño, and as many of you are aware, it has an enormous impact on global weather. You can easily begin to guess why it might as that area in red is huge, actually covering as big an area as the continental United States. That warm water heats a large area of the atmosphere and disrupts the weather globally. On the other side of the globe, and not as well publicized, the Indian Ocean was seeing the warmest temperatures it had seen in over 40 years. It is the moisture and heat provided by these warm sea surface temperatures off the east coast of Africa that was responsible for the torrential rains and floods experienced then. As we continue around the globe we come to the Atlantic Ocean. |  View Movie: [2.1 MB QuickTime] [11.5 MB MPEG-1] |
| Now when I see the Atlantic ocean, I think of the Gulf Stream. The Gulf Stream is the Willie Mays of ocean currents. Its waters move at the break neck speed of almost 5 miles per hour. That's really moving in the ocean. We're going to look at the Gulf Stream through one of NASA's new sensors, MODIS, which is on the first EOS platform. I'd like you to notice the unprecedented detail we are now able to see at systems like the Gulf Stream. The Gulf Stream meanders its way through the North Atlantic shedding pools of warm and cold water along the way. We call these pools eddies, and they are analogous to the low and high pressure systems you see in the atmosphere. These are the ocean's storms. You can see how the Gulf Stream narrows as it gives up heat to the atmosphere as it moves on its northeastward path. Some of the water is still warm as it reaches the other side of the ocean - warm enough to heat the atmosphere so that you find palm trees on the west coast of Ireland. | 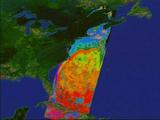 View Movie: [1.5 MB QuickTime] [7.9 MB MPEG-1] |
| The MODIS instrument not only looks at temperature structures, it also has the ability to look at ocean color. What makes the color of the water so interesting? Depending on how much life there is in the water, the color of the water changes and this can be viewed from space. That life indicated by the ocean color represents the lowest rung of the food chain. In this sequence, we're viewing the color of the Pacific Ocean from another NASA instrument run out of Goddard called SeaWiFS. Higher concentrations of biology are indicated by the light green colors. The change over the equator you see is the recovery from the 1997 El Niño. We're going to zoom in on the Galapagos and watch a two week transition from almost no life in the water to a hundred fold increase in life in the water once the El Niño ended. The lack of life and that lowest part of the food chain in the ocean during El Niño resulted in a 100% mortality rate for the juvenile bird and marine mammal population in the equatorial Pacific. El Niño affects more than people. That change over two weeks is incredible isn't it? | 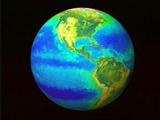 View Movie: [1.0 MB QuickTime] [6.5 MB MPEG-1] |
| I've mentioned El Niño more than once and we're going to see a rather unique view of the 1997 event as viewed from different sensors that measure temperature, the wind, and sea surface height. Sea surface height is important because it is a measure of how much heat is stored in the water. Water expands when it's heated, and this causes the height of the ocean to change. The last El Niño was so strong that the sea surface height changed by about two feet off the coast off South America, due to water expansion. You can see how the height gets elevated when the water warms, but now we're gong to add the atmospheric response, the winds. Look how the wind is quickly drawn to the warm water. This is what changes the global weather. We've essentially put a barrier into the normal atmospheric flow. Disrupting that flow. This barrier, remember as big as the United States is large enough to affect the weather patterns around the globe. Another analogy I like to use is throwing a rock in a pond. There's a big splash where you throw in the rock, but lots of ripples elsewhere. That blue patch of water you see at the end of this animation is the La Nina that lasted for two years and just ended this past spring. La Nina also affects global weather patterns. It is also a barrier, except the winds are pushed away from the cold water of La Nina as opposed to being drawn in as happens during an El Niño. | 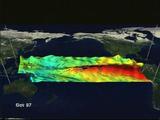 View Movie: [1.8 MB QuickTime] [12.0 MB MPEG-1] |
| Over the past 25 minutes, we've shown you a number of views of our planet in a way many of you have probably never seen before. How does NASA and Goddard bring this menagerie of information that is gathered from space together? How can this information be used to help you? NASA is a technology agency as well as a space agency. Goddard has always been able to maintain itself at the forefront of computer technology. Three years ago, NASA dedicated what was then the fifth most powerful computer in the world to the NASA Seasonal to Interannual Prediction Project, NSIPP for short. NSIPP endeavours to take the data from various space sensors and ingest that information into a computer model of the earth's climate system in order to predict short term changes in the climate system, events such as El Niño. The computer model includes where we live, the land, the environment that for the most part we live in, the atmosphere, and the memory of the climate system, the ocean. Let's take a look at what a model forecast looks like. | |
| This one year ocean forecast out to June 2001 is shown quickly because, the ocean, our memory here, reacts more slowly than other parts of the climate system. You'll note the warm temperatures in the tropical Pacific at the end of this forecast. Yes, that's an El Niño predicted by this model. By the way, that time bar changes color on September 14th. Now I don't want you leaving here with the idea that there's an El Niño coming next year. This model, and every other model in the world, does not have the skill to make skillful forecasts that far into the future. So why do I show you this forecast if there's no skill? Well, we might get lucky and maybe the forecast is good. But, more importantly this forecast demonstrates that the model is taking into account processes that are capable of generating realistic El Niños. There's hope, the model can do it, we just have to work now to make it skillful. Let's take a look at more of the model's forecast. | 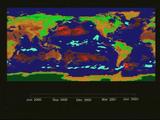 View Movie: [0.3 MB QuickTime] [1.6 MB MPEG-1] |
| You are now looking at the same forecast, but with the added variability of the water vapor in the atmosphere and the soil moisture in the land. There are deficiencies with the model that we're working to correct,but there's a lot right with this model too. For example, I would challenge anybody to be able to distinguish the variations in the water vapor, represented by the mist on this visualization, from the time lapse satellite water vapor loops you sometimes see on television weather broadcasts. Those phantom-like fingers you see are the storm fronts, the day-to-day weather. The soil moisture can not be emphasized enough in this forecast. Wet conditions are indicated by green and dryer conditions by brown in this visual. There is currently no global network for soil moisture observations, and only sparse observations over the United States. Yet, soil moisture is so important for our agriculture, and as we've seen this past summer, for wild fire potential. It is a crucial part of the climate system that needs to be better understood. You can see how closely tied the soil moisture is tied to the water vapor variations in the atmosphere. | 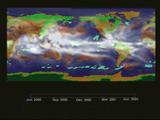 View Movie: [1.9 MB QuickTime] [10.8 MB MPEG-1] |
| The model is global, but let's zoom in on North America and replay the visual. You can see how dry the west is at the start of this forecast. You can also watch the southern tier of the United States eventually recover from dry conditions as this particular scenario evolves. One thing I like to watch during this view is the storms during winter consistently hitting the northwest United States, and then the El Niño appears and the storms move further south and start slamming into the California coast. Also watch for the southeast to get particularly moist as often happens during an El Niño. | 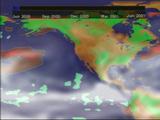 View Movie: [2.0 MB QuickTime] [10.8 MB MPEG-1] |
|
Before I pass the podium back to Dr. Asrar, I wanted to make a few closing remarks. Is this model perfect? Certainly not. Is it useful? Well sure, even if only to start to understand how events like El Niño occur. Will it get better? You bet it will! NASA has just begun its series of new satellites comprising the Earth Observing System. The unprecedented resolution and types of data that will be available make it an incredibly exciting time for the people who are involved or just interested in earth science. There is one thing I can forecast with some degree of certainty. If you like what you've seen tonight, you ain't seen nothing yet. |
View Movie: [0.6 MB QuickTime] [3.3 MB MPEG-1] |