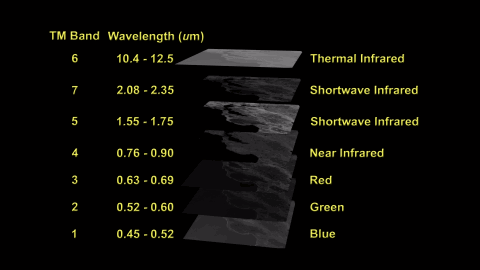
Creating Landsat Images from Raw Data

Landsat TM spectral range
The spectral range of the Landsat Thematic Mapper (TM) instrument

Landsat TM spectral range
TM images of San Franciso Bay in all 7 TM spectral bands

Combining TM 542 to make an image
Combining TM bands 5, 4, & 2 to make an image

TM 542 image of San Francisco Bay
TM 542 image of San Francisco Bay (combined with terrain data)

TM 542 image of San Francisco Bay
TM 543 image of San Francisco Bay

TM 542 image of San Francisco Bay
TM 432 ("False color infrared") image of San Francisco Bay

TM 542 image of San Francisco Bay
TM 321 ("Natural color") image of San Francisco Bay

TM 542 image of San Francisco Bay
TM 753 image of San Francisco Bay

These images are compressed versions of high definition television (HDTV) images showing how Landsat data, which spans a very broad swatch of the electromagnetic spectrum, can be turned into images. The TIFF versions of these images are full resolution HDTV frames (1920 x 1080). All images have the HDTV standard aspect ratio (16:9).

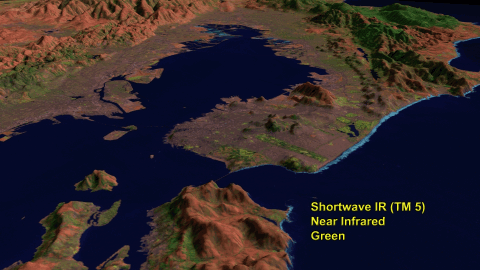
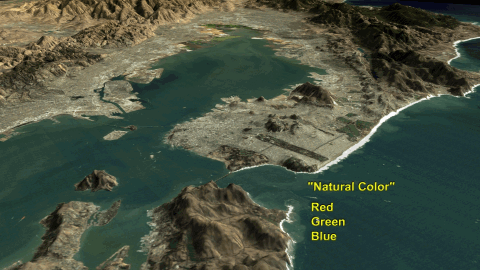
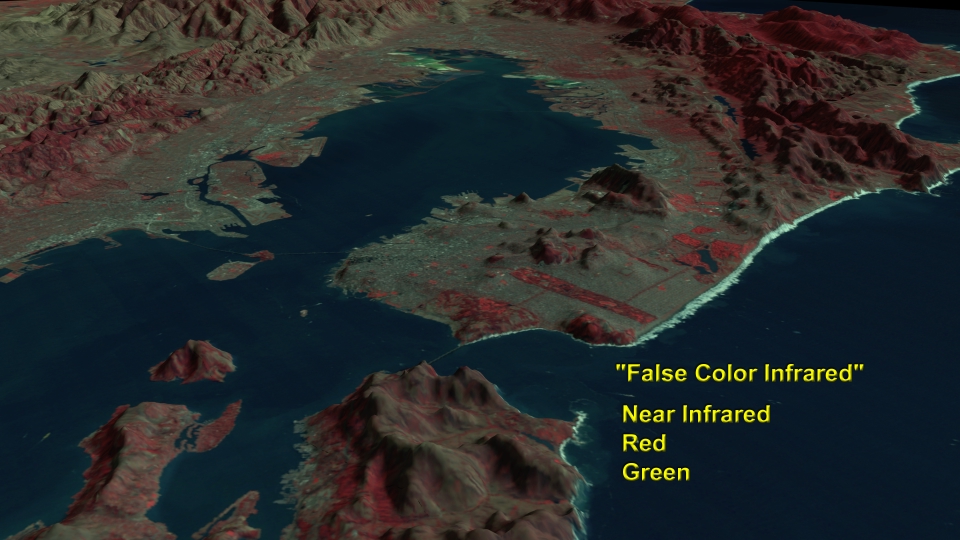
The Thematic Mapper (TM) on Landsat 4 and 5 observes reflected sunlight from the Earth all the way from blue in the visible part of the electromagnetic spectrum to shortwave infrared well beyond the ability of the human eye to percieve. The TM instrument also can observe infrared radiation actively emitted by the Earth from thermal infrared radiation. Landsat 7 carries an improved version of the TM instrument, called ETM+. In addition to 7 channels of spectral data collected by the older TM instruments, ETM+ can observe in a special panchromatic band spanning the entire visible spectrum at twice the resolution of the TM bands (15 meter resolution instead of 30 meters). The ETM+ also has a major improvement in the resolution of the thermal band (60 meter resolution instead of 160 meters).

A standard way to create images from raw Landsat TM and ETM+ data is to display a single band as a primary color, then combine different bands to create a full color image. Images shown here demonstrate combining three bands to make a color image using TM bands 5, 4, & 2, which covers a very broad range of the TM's spectral coverage. It is also shown in combination with a digital elevation model. Terrain data is shown with vertical features exagerated by a factor of three to emphasize details.

Images: Spectral range of the Landsat Thematic Mapper: GIF (11 k)
San Francisco as seen by all 7 TM bands: GIF (17 k)
Combining three bands to make a color Landsat image: GIF (18 k)
Spectral range of the Landsat Thematic Mapper: JPEG (100 k)
San Francisco as seen by all 7 TM bands: JPEG (127 k)
Combining three bands to make a color Landsat image: JPEG (127 k)
Spectral range of the Landsat Thematic Mapper: TIFF (178 k)
San Francisco as seen by all 7 TM bands: TIFF (472 k)
Combining three bands to make a color Landsat image: TIFF (495 k)

Labeled versions of San Francisco Bay images:
TM 542: GIF (80 k)
TM 543: GIF (78 k)
TM 432: GIF (76 k)
TM 321: GIF (91 k)
TM 753: GIF (85 k)
TM 542: JPEG (380 k)
TM 543: JPEG (380 k)
TM 432: JPEG (354 k)
TM 321: JPEG (432 k)
TM 752: JPEG (419 k)
TM 542: TIFF (4.3 M)
TM 543: TIFF (4.4 M)
TM 432 (False Color Infrared): TIFF (3.9 M)
TM 321 (Natural Color): TIFF (5.7 M)
TM 753: TIFF (4.3 M)

Unlabeled versions of San Francisco Bay images:
TM 542: GIF (67 k)
TM 543: GIF (69 k)
TM 432: GIF (67 k)
TM 321: GIF (90 k)
TM 753: GIF (63 k)
TM 542: JPEG (332 k)
TM 543: JPEG (334 k)
TM 432: JPEG (307 k)
TM 321: JPEG (423 k)
TM 752: JPEG (378 k)
TM 542: TIFF (4.6 M)
TM 543: TIFF (4.8 M)
TM 432 (False Color Infrared): TIFF (4.1 M)
TM 321 (Natural Color): TIFF (5.7 M)
TM 753: TIFF (4.7 M)

Technical notes:
Rendered: March 1999
Data source: Landsat 5 Thematic Mapper; USGS 3-arcsecond DTED
Data date: 27 September 1997
For: The Landsat Project Team and Goddard Public Affairs Office