THE SUN'S CHILLY IMPACT ON EARTH
|
Image One
|
Caption for Image One and animations: Unusually low solar activity between 1645-1715 likely triggered the 'Little Ice Age' in regions like Europe and North America. A lag time of arguably 10-30 years allowed for the climate system to be affected by an increased ozone layer that altered the heating of the oceans. According to the model, diminished jet stream winds caused by a dimmer sun created cold land temperatures by reducing the transport of warm Pacific air to America and warm Atlantic air to Europe. During this shift, winter temperatures cooled as much as 2 to 4 degrees F - enough to freeze rivers and alter agriculture, economy, disease, etc. Pictured is the climate model used by researchers to watch temperature anomalies. As such, 1780 was used as an arbitrary baseline; the ice age period, then, is colder/bluer and 1780 is white or neutral. Redder colors in more modern times reflect warmer temperatures. |
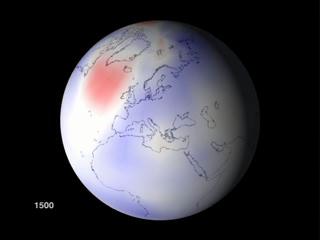
A new NASA computer climate model reinforces the long-standing theory that low solar activity could have changed the atmospheric circulation in the Northern Hemisphere from the 1400s to the 1700s and triggered a "Little Ice Age" in several regions including North America and Europe. Changes in the sun's energy was one of the biggest factors influencing climate change during this period, but have since been superceded by greenhouse gases due to the industrial revolution.
|
Image Two
|
Image Three
|
Caption for Images Two and Three: The few degrees' difference was catastrophic regionally. Greenland was largely cut off by ice from 1410 to the 1720s and canals in Holland routinely froze solid. Glaciers advanced in the Alps, and iced waterways effectively sealed off Iceland in 1695. In North America, Native Americans formed leagues in response to food shortages. Rivers in Europe that were typically ice-free, froze over and inspired 'Frost Fairs' as well as activities like skating and even golf as seen in both works of art. |
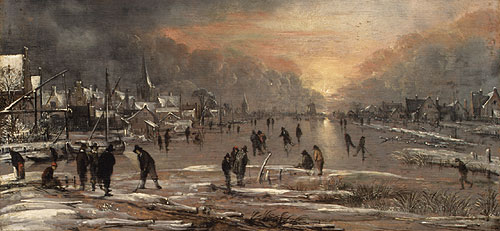

During the Little Ice Age, access to Greenland was largely cut off by ice from 1410 to the 1720s. At the same time, canals in Holland routinely froze solid, glaciers advanced in the Alps, and sea-ice increased so much that no open water was present in any direction around Iceland in 1695.
Drew Shindell of NASA's Goddard Institute for Space Studies and other researchers have used a computer model to reconstruct climate and atmospheric conditions from the present back to the Little Ice Age.
They determined that a dimmer Sun reduced the model's westerly winds, cooling the continents during wintertime. Shindell's model shows large regional climate changes, unlike other climate models that show relatively small temperature changes on an overall global scale. Other models did not assess regional changes.
|
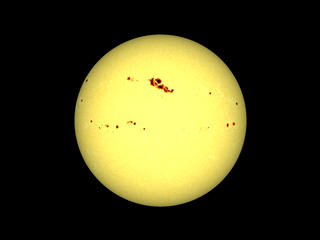
Image Four
|
Caption for Image Four:
The Sun shows signs of variability, such as its eleven-year
sunspot cycle. In that time, it goes from a minimum (seen
here in 1996) to a maximum (2000) period of activity that
affects us everyday. When particularly active, solar storms
can spew tons of radiation to Earth in the form of Coronal
Mass Ejections (CMEs) that can affect power grids, spacecraft,
and communication systems. |
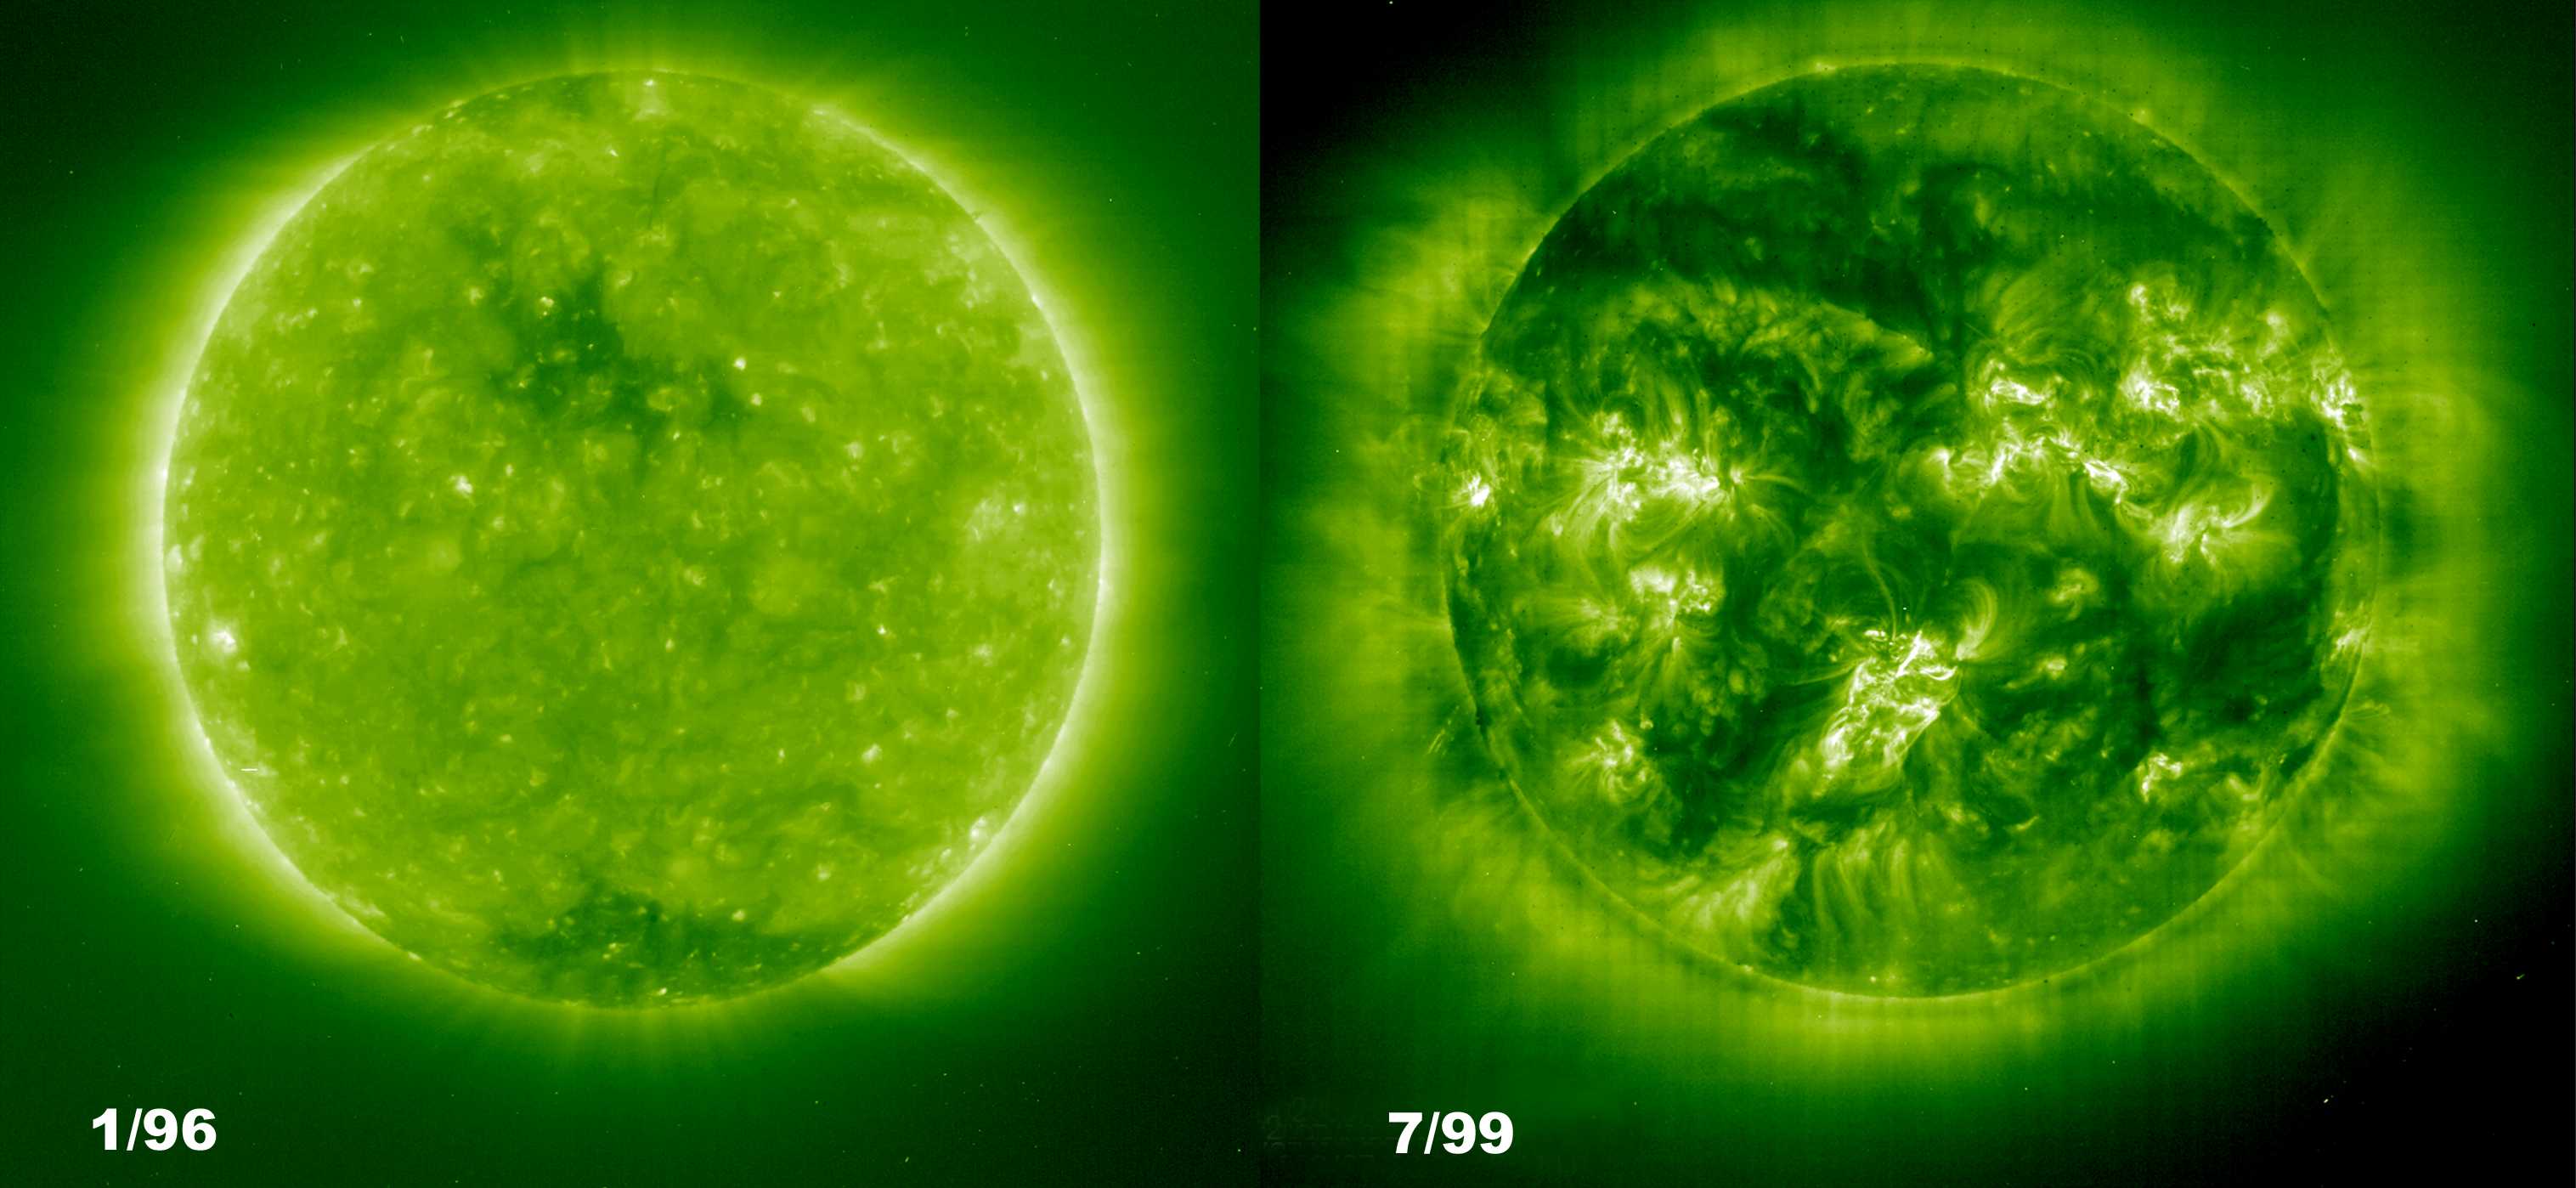
During the coldest part of the Little Ice Age, from 1645 to 1715, there is believed to have been a decrease in the total energy output from the Sun, as indicated by little or no sunspot activity. Known as the Maunder Minimum, astronomers of the time observed only about 50 sunspots for a 30-year period as opposed to a more typical 40-50,000 spots. The Sun normally shows signs of variability, such as its eleven-year sunspot cycle. Within that time, it goes from a minimum to a maximum period of activity represented by a peak in sunspots and flare activity.
|
Image Five
|
Caption for Image Five:
Astronomers of the time kept a good record of sunspot activity
during the Maunder Minimum, encountering only about 50 sunspots
in 30 years, as opposed to a typical 40-50,000. Here are Galileo's
sunspot drawings from 1611, prior to the Maunder Minimum.
Three other drastic minimums have been observed: the Oort
Minimum (1010-1050), the Wolf Minimum (1280-1340) and the
Spoerer Minimum (1420-1530). |
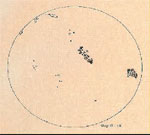
Beginning in 1611, Galileo Galilei made drawings of lower sunspot activity before the Maunder Minimum. Records of sunspot activity during the Minimum from other astronomers confirm the lower number of sunspots over the70 year event.
During those periods of low solar activity, levels of the Sun's ultraviolet radiation decrease, and can significantly impact ozone formation in the stratosphere. "The changes in ozone that we modeled were key in producing the enhanced response," Shindell said. "The changes in the upper atmosphere then feed down to the surface climate."
|
Image Six
|
Caption for Image Six: In this case, the low solar activity depicted by fewer sunspots) during the Maunder Minimum meant decreased UV radiation which impacted the protective ozone formation in the upper atmosphere (stratosphere). The changes, then, in the upper atmosphere, feed down to the surface climate and affect many systems, including the Arctic Oscillation/North Atlantic Oscillation. These are jet stream systems that would transport warmer air to America and Europe. SUPER: NASA / ESA |
Between the mid-1600s and the early 1700s the Earth's surface temperatures in the Northern Hemisphere appear to have been at or near their lowest values of the last millennium. European winter temperatures over that time period were reduced by 1.8 to 2.7 degrees Fahrenheit (1-1.5 Celsius). This cool down is evident through derived temperature readings from tree rings and ice cores, and in historical temperature records, as gathered by the University of Massachusetts-Amherst and the University of Virginia.
|
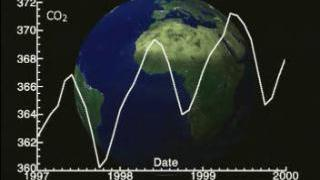
Image Seven
|
Caption for Image Seven:
The lack of activity on the Sun was strongly felt during the
Little Ice Age, yet scientists credit greenhouse gases and
global warming with having such an impact on us today. Most
experts point to 1850, start of the industrial age, to when
the major influence of climate started to shift from the Sun
to ourselves. Click on the image to take you to the NASA
Carbon Cycle Initiative site. In the first graph on the
site, a flat line reflects steady carbon measurements prior
to 1850. The other graphs show a stable increase of ambient
carbon dioxide oscillating as a general trend, but still rising
and falling with seasonal change. |
Shindell noted that the effects of this period of a dimmer Sun were concentrated more regionally than globally. "Global average temperature changes are small, approximately .5 to .7 degrees Fahrenheit (0.3-0.4C), but regional temperature changes are quite large." Shindell said that his climate model simulation shows the temperature changes occurring mostly because of a change in the Arctic Oscillation/North Atlantic Oscillation (AO/NAO).
This oscillation is basically a hemispheric-scale see-saw of atmospheric pressure and temperature between the mid latitudes and the Arctic which modulates the strength of the westerly jet stream winds. These winds are reduced as the AO/NAO shifts in response to a dimmer sun. Because the oceans are relatively warm during the winter due to their large heat capacity, the diminished flow creates cold land temperatures by reducing the transport of warm Pacific air to America, and warm Atlantic air to Europe. During this shift, winter temperatures cooling of as much as 2 to 4 degrees Fahrenheit (1-2C).
The paper, "Solar forcing of regional climate change during the Maunder Minimum," by authors Drew Shindell, Gavin Schmidt, and David Rind, from NASA's Goddard Institute for Space Studies and co-authors Michael Mann and Anne Waple, from the Universities of Virginia and Massachusetts respectively, appears in the December 7 issue of Science.
"The period of low solar activity in the middle ages led to atmospheric
changes that seem to have brought on the Little Ice Age. However,
we need to keep in mind that variations in solar output have
had far less impact on the Earth's recent climate than human
actions," Shindell said. "The biggest catalyst for
climate change today are greenhouse gases," he added.
For more information on Dr. Shindell's research.
For more information on Aert van der Neer's Winter Scene on a Frozen Canal, click here to visit the Fine Arts Museums of San Fransisco's web site.
For more information on Aert van der Neer's Sports on a Frozen River, click here to visit the Metropolitan Museum's web site.