El Niño Visualizations
NASA-Goddard Space Flight Center
Released 6/11/98
The animations and images below show a combined perspective of the El Niño induced change in the sea surface topography as viewed from space by the NASA TOPEX radar altimetry satellite and sea surface temperature observed by NOAA's AVHRR sensor for the period from June 1997 to June 1998. Data illustrating sea biology as observed by the SeaWiFS instrument show phytoplankton concentrations around the Galapagos Islands.The three dimensional relief map shows a sea level rise along the Equator in the eastern Pacific Ocean of up to 34 centimeters with the red colors indicating an associated change in sea surface temperature of up to 5.4 degrees Celsius. Also shown is a combined perspective of the the weakening of the Trade Winds across the Pacific Ocean and the associated increase in sea surface temperature. The convergence of the surface wind field into the anomalous warm water regions indicates a continued strengthening of this El Niño event. The sea temperature below the surface as measured by NOAA's TAO moorings is shown illustrating how the thermocline (the boundary between warm and cold sea water at 20 degrees Celcius) is flattened out by El Niño.
|
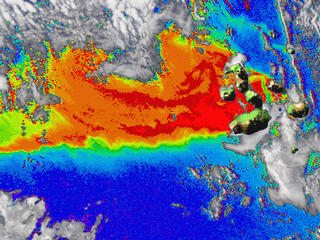
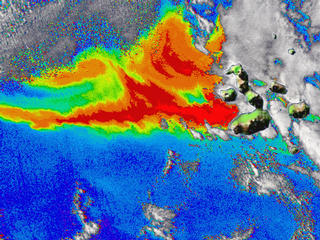
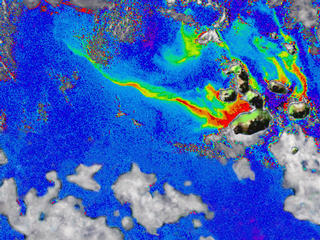
May 1998 Phytoplankton Bloom in Galapagos Views of phytoplankton concentrations from several dates during May of 1998 shows the beginnings of recovery of the ocean food chain illustrated by the massive blooms. This change happened over a 2 week period. Data from 5/10/98 to 5/25/98. |
|||||
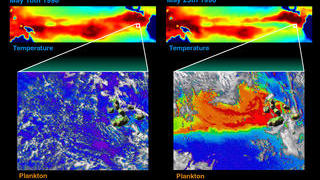 |
May 1998 Phytoplankton - Sea Surface Temperature Correlation in Galapagos This image illustrates the direct correlation between the sea surface temperature and the phytoplankton concentrations around the Galapagos Islands. As the sea surface cools rapidy in early May indicating an upwelling of cool, nutrient filled waters from below, the phytoplankton rapidly begin to bloom. This occurs over the course of only 2 weeks. | |||||
|
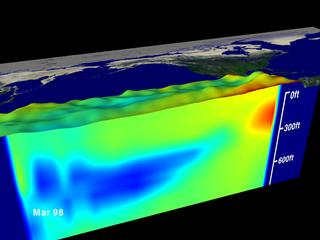
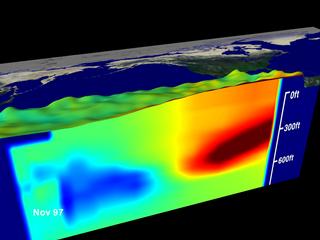
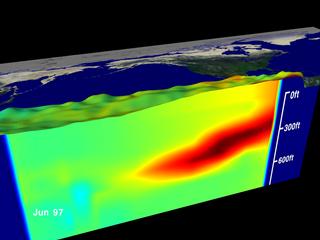
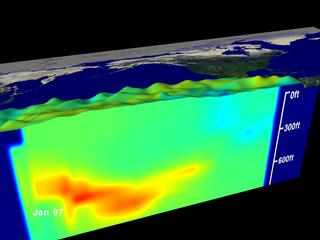
1997-98 Temperature Anomalies Beneath the Sea Views of sea surface height (represented by the bumps) and sea temperature (represented by the color). Red is 10 degrees C above normal, blue is 10 degrees C below normal. Notice the large area of colder than normal water shutting off El Niño towards the end of the animation. Data from 6/97 to 6/98. | |||||
 |
1997-98 Sea Surface Height Anomaly Shows the difference in sea level between 1997-98 and a normal year (red is 15 cm above normal, blue is 15 cm below normal). Data from 6/97 to 6/98 Movie (1374 K) | |||||
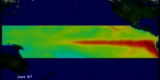 |
1997-98 Sea Surface Temperature Anomaly Shows the difference in sea surface temperature between 1997-98 and a normal year (red is 5 degrees C above normal, blue is 5 degrees C below normal). Data from 6/97 to 6/98. Movie (1352 K) |


High resolution image showing the peak of the El Nino event showing the SST color superimposed on the sea level topography with wind vectors on top.
Images and Animations produced: | ||||
|