SVS Tapes
Title: Terra: First Light
Abstract: The first results from TERRA
Metadata date: 2000-04-19
Producer: Wade Sisler
Trt: 00:29:18:00
Audio: No Audio
-
*Please note: the SVS does not fulfill requests for copies of the tapes in our library. On some of our animation pages, there is a direct link to a video distribution service from which tapes, handled by the Public Affairs Office (PAO)/Goddard TV, including some of our animations may be ordered. General information on this service can be found here.
-

Terra First Light Visualizations: North America
1:00:22:00 - 1:04:26:00 -
First Light Image from MODIS (First Draft)
1:04:26:00 - 1:05:51:00 -
First Light Image from MODIS (Second Draft)
1:05:51:00 - 1:09:41:00 -
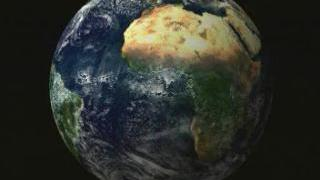
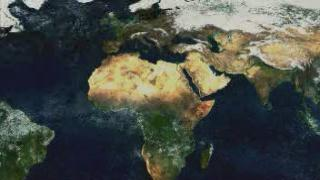
Global Surface Reflectance (MODIS)
1:09:41:00 - 1:11:00:00
-
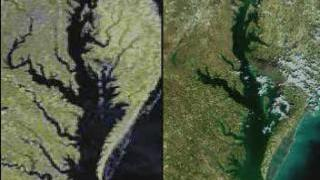
A Comparison of MODIS with AVHRR
1:11:00:00 - 1:11:57:00 -
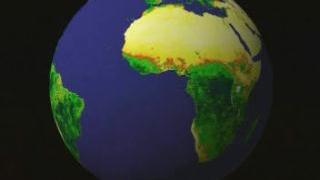
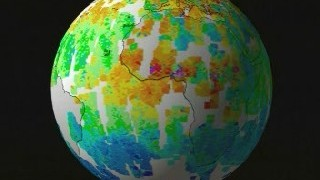
Global Vegetation Index
1:11:57:00 - 1:13:16:00 -
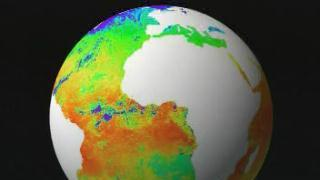
Global Sea Surface Temperature Without Land
1:13:16:00 - 1:14:34:00 -
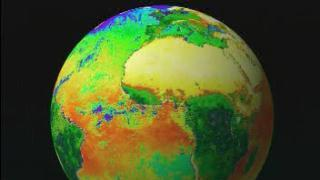
Global Sea Surface Temperature and NDVI
1:14:34:00 - 1:15:53:00
-
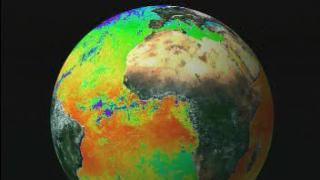
Global Sea Surface Temperature and MODIS
1:15:53:00 - 1:17:11:00 -
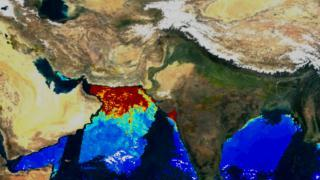
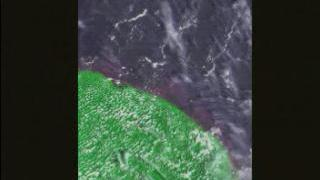
Chlorophyll in the Bay of Bengal with Fluorescence
1:17:11:00 - 1:18:09:00 -
Cloud Optical Thickness Effective Particle Radius
1:18:09:00 - 1:18:59:00 -
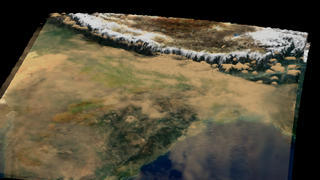
Focus on INDOEX (First Version)
1:18:59:00 - 1:20:10:00
-
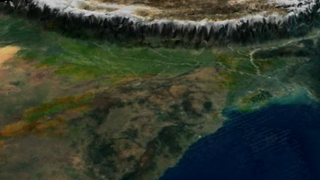
Terra: Focus on INDOEX (Second Version)
1:20:10:00 - 1:21:55:00 -
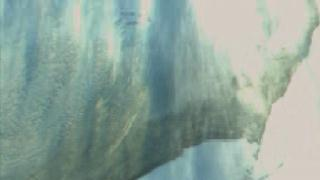
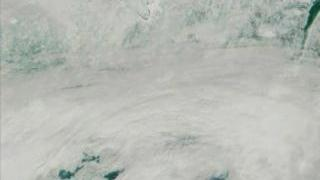
Larsen Clouds
1:21:55:00 - 1:22:39:00 -
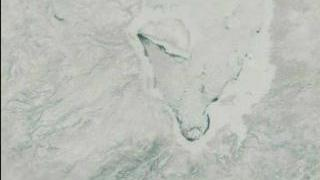
South American Cirrus Clouds
1:22:39:00 - 1:23:24:00 -
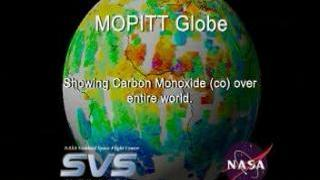
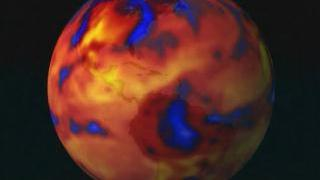
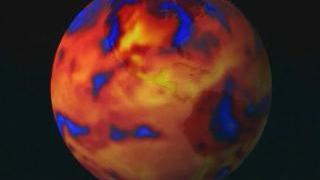
MOPITT Globe
1:23:24:00 - 1:25:23:00
-
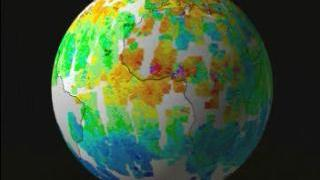
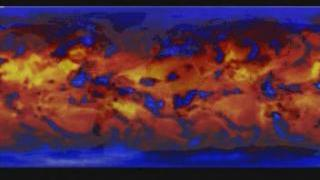
MOPITT Globe Unwrap
1:24:42:00 - 1:25:23:00 -
MOPITT Globe Unwrap with Zoom into TRMM Fire Data
1:25:23:00 - 1:26:22:00 -
CERES Globe
1:26:22:00 - 1:27:34:00 -
CERES Flat Map
1:27:34:00 - 1:28:15:00
-
CERES to MISR Sequence
1:28:15:00 - 1:29:40:00