Skip all navigation and jump to content Jump to site navigation Jump to section navigation.
NASA Logo - Goddard Space Flight Center + Visit NASA.gov
HOME PROJECTS RESOURCES SEARCH MAP

+ Advanced Search
Home
Home
View Most Recently Released Imagery
View Gallery of Imagery: A topical collection of SVS Imagery
Search Imagery by the keywords assigned to it
Search Imagery by the instruments that supplied data for a visualization product
Search Imagery by the series of visualizations that have been produced
Search Imagery by the scientist providing the data used in a visualization product
Search Imagery by the animator that created the product
Search Imagery by the identification number assigned to the visualization product
See other search options
Learn about the SVS Image Server
  + About the Server
  + Animation List
  + How to Use the Server


  + RSS Feeds
  + Podcasts


  + Opportunities
blank image

Goddard TV Video Tape: G1999-097


Movie ID Title
Topography of Argyre Planitia as measured by MOLA 776 
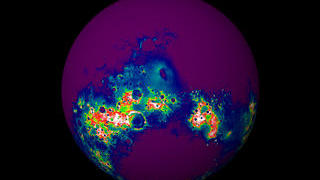
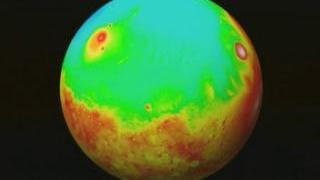
Mars Southern Hemisphere Rotation in False Color from MOLA
Watching Viking imagery data of the southern hemisphere of Mars on a rotating globe 775 
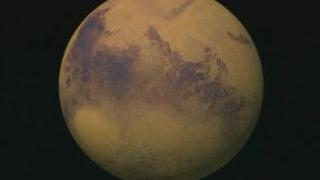
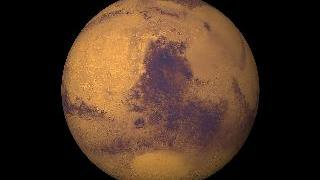
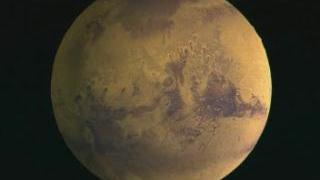
Mars Southern Hemisphere Rotation in True Color from Viking
A view of the topography of the southern hemisphere of Mars, using a color table designed to highlight the topography at the south pole.  White colors indicate elevations in excess of 3012 meters, red shows elevations between 2500 and 3012 meters, yellow shows elevations from 2450 to 2500 meters, dark cyan shows elevations from 2150 to 2450 meters, dark violet shows elevations from 320 to 2150 meters. 774 
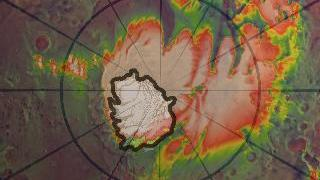
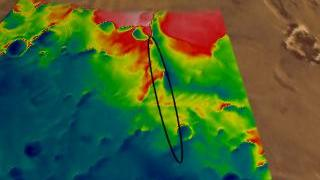
Push in South of the Hellas Basin Showing Topography from MOLA: New Color Map
A view of the southern hemisphere of Mars showing topography data from MOLA.  Blue tones represent elevations of less than 2 kilometers, while reddish tones are greater than about 2.8 kilometers, relative to the mean equatorial height of Mars. 773 Push in South of the Hellas Basin Showing Topography from MOLA
The southern hemisphere of Mars from Viking imagery 772 
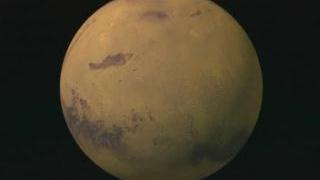
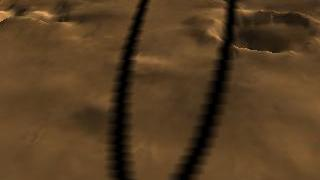
Push in South of the Hellas Basin using Viking Imagery
A rotating view of the Martian south pole using MOLA topography data.  This animation uses a color table designed to highlight the topography at the south pole.  White colors indicate elevations in excess of 3012 meters, red shows elevations between 2500 and 3012 meters, yellow shows elevations from 2450 to 2500 meters, dark cyan shows elevations from 2150 to 2450 meters, dark violet shows elevations from 320 to 2150 meters. 771 
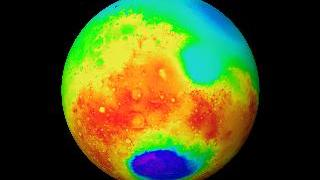
A Rotating False Color View of the Martian South Pole from MOLA: New Color Map
A rotating view of the Martian south pole using MOLA topography data 770 A Rotating False Color View of the Martian South Pole from MOLA
A close-up view of the Martian south pole with grid lines, from Viking imagery 769 A Rotating True Color View of the Martian South Pole
A visible image of the Martian south pole, from Viking data, overlaid over a false color image of the topography of the region as measured by MOLA 768 A Comparison of Visible and Topographic Data for the Martian South Pole: Version 2
Rotating a Martian globe, using Viking imagery, to the south pole and fading to topography data from MOLA, showing that large portions of the ice cap may be covered by dust.  Note that the permanent frozen cap of carbon dioxide ice is not located directly at the south pole.  White colors indicate elevations in excess of 3012 meters, and dark violet shows elevations from 320 to  2150 meters. 767 A Comparison of Visible and Topographic Data for the Martian South Pole: Version 1
High altitude view of the Mars Polar Lander landing site in false color, with color representing topography as measured by MOLA. 766 Close Up Fly Over of Mars Polar Lander Landing Area in False Color
Overhead view of the Mars Polar Lander landing site 765 Close Up Fly Over of Mars Polar Lander Landing Area in True Color
Zoom from a global view of Mars from Viking imagery to the Mars Polar Lander landing site near the south pole of Mars, using a false color inset of MOLA topography data.  White colors indicate elevations in excess of 3012 meters, red shows elevations between 2500 and 3012 meters, yellow shows elevations from 2450 to 2500 meters, dark cyan shows elevations from 2150 to 2450 meters, dark violet shows elevations from 320 to 2150 meters. The topography in these images is vertically exaggerated by a factor of 5. 764 Mars Polar Lander Landing Site: Global View to False Color MOLA Inset

*Please note: General information on how to order a copy of one of these tapes, handled by the Public Affairs Office (PAO)/Goddard TV, can be found here. Look under the "NASA Goddard Video Library".


USA.gov logo - the U.S. Government's official Web portal. + Privacy Policy and Important Notices
+ Reproduction Guidelines
NASA NASA Official:
SVS Contact:
Curator: