Earth
ID: 4452
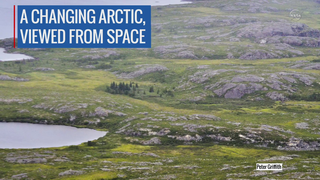
High-latitude regions have been warming rapidly since the last century, at a rate higher than the global average. At continental scales, satellite data since the 1980s have indicated increased vegetation productivity (greening) across northern high latitudes, and a productivity decline (browning) for certain areas of undisturbed boreal forest of Canada and Alaska. These remote sensing results have been corroborated by in-situ evidence.
This research provides a spatially complete view of the vegetation greenness change for all of Canada and Alaska by calculating per-pixel NDVI trend from all available 1984–2012 peak-summer Landsat-5 and -7 surface reflectance data. By incorporating observations from overlapping scenes, researchers obtained up to 160 valid NDVI values for certain areas from this 29-year period, establishing the mid-Summer greenness trend.
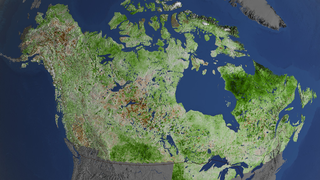
This animation shows the resulting greenness trend over Canada and Alaska with special attention focused on the regions of Quebec and northern Alaska.
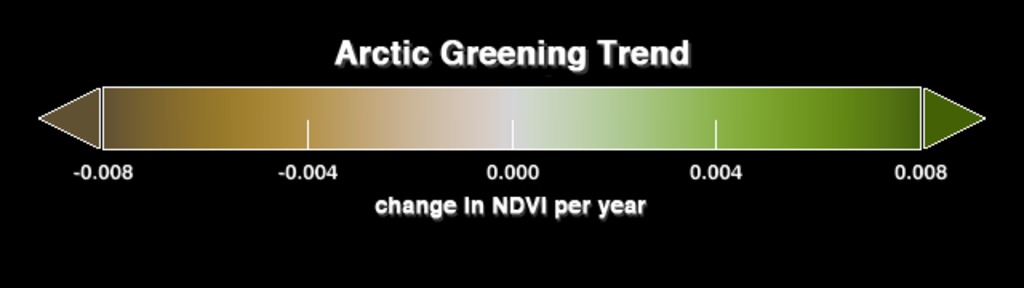
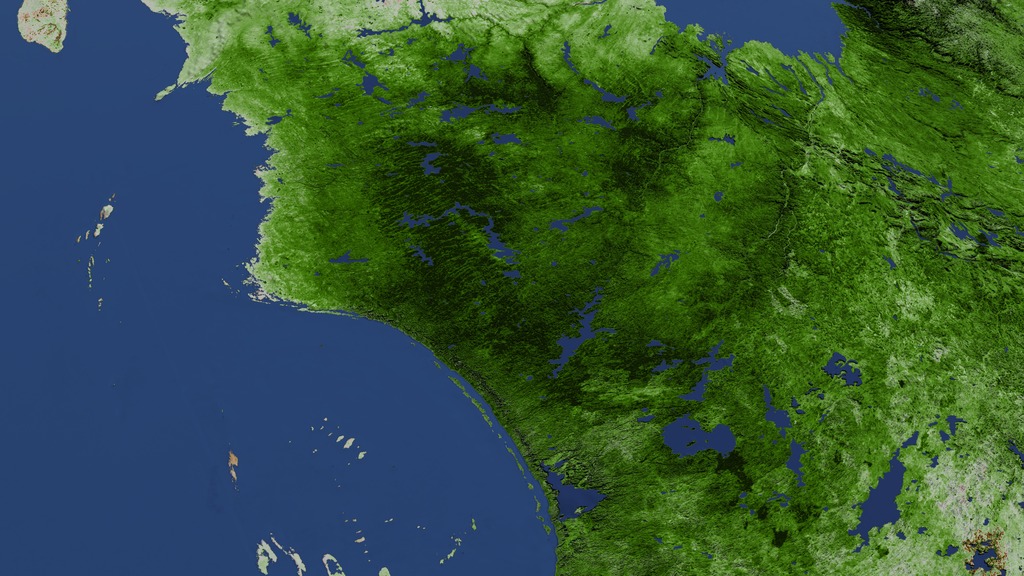

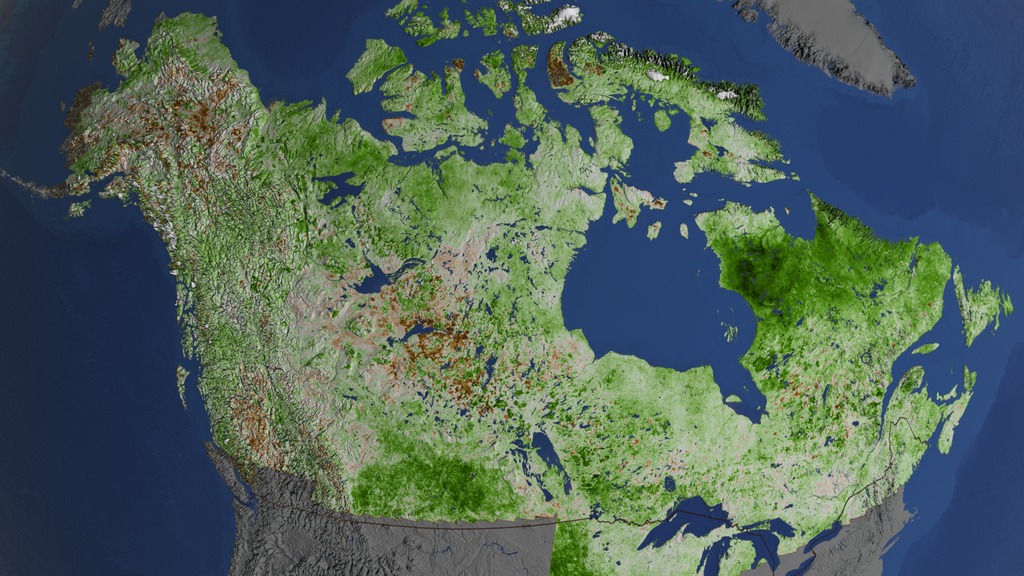
Vegetation Greening Trend in Canada and Alaska: 1984-2012
This research provides a spatially complete view of the vegetation greenness change for all of Canada and Alaska by calculating per-pixel NDVI trend from all available 1984–2012 peak-summer Landsat-5 and -7 surface reflectance data. By incorporating observations from overlapping scenes, researchers obtained up to 160 valid NDVI values for certain areas from this 29-year period, establishing the mid-Summer greenness trend.
This animation shows the resulting greenness trend over Canada and Alaska with special attention focused on the regions of Quebec and northern Alaska.
Used Elsewhere In
Visualization Credits
Cindy Starr (Global Science and Technology, Inc.): Lead Visualizer
Junchang Ju (USRA): Scientist
Jeffrey Masek (NASA/GSFC): Scientist
Matthew R. Radcliff (USRA): Producer
Eric Sokolowsky (Global Science and Technology, Inc.): Data Provider
Joycelyn Thomson Jones (NASA/GSFC): Project Support
Leann Johnson (Global Science and Technology, Inc.): Project Support
Laurence Schuler (ADNET Systems, Inc.): Technical Support
Ian Jones (ADNET Systems, Inc.): Technical Support
Please give credit for this item to:
NASA's Scientific Visualization Studio
NASA's Scientific Visualization Studio
Science Paper:
http://www.sciencedirect.com/science/article/pii/S0034425716300013
Short URL to share this page:
https://svs.gsfc.nasa.gov/4452
Missions:
Landsat
LDCM: Landsat Data Continuity Mission
Data Used:
Note: While we identify the data sets used in these visualizations, we do not store any further details nor the data sets themselves on our site.
Keywords:
SVS >> Landsat
SVS >> NDVI
GCMD >> Location >> Canada
GCMD >> Location >> Alaska
SVS >> Hyperwall
NASA Science >> Earth
GCMD keywords can be found on the Internet with the following citation: Olsen, L.M., G. Major, K. Shein, J. Scialdone, S. Ritz, T. Stevens, M. Morahan, A. Aleman, R. Vogel, S. Leicester, H. Weir, M. Meaux, S. Grebas, C.Solomon, M. Holland, T. Northcutt, R. A. Restrepo, R. Bilodeau, 2013. NASA/Global Change Master Directory (GCMD) Earth Science Keywords. Version 8.0.0.0.0
http://www.sciencedirect.com/science/article/pii/S0034425716300013
Short URL to share this page:
https://svs.gsfc.nasa.gov/4452
Missions:
Landsat
LDCM: Landsat Data Continuity Mission
Data Used:
Landsat/Landsat NDVI Trend (1984–2012)
1984-2012
This research used a nominal peak greenness period, July 1 to August 31, to accommodate tundra of all regions for Landsat data selection. We only considered the terrain-corrected scenes, excluding scenes that have cloud cover more than 80%. As a result, a total of 87,762 Landsat scenes over 1271 Path/Row locations were selected from 1984-2012. Of these, 63% were from Landsat-5, as Landsat-5 provided the only data source for 1984-1998 and continued to acquire data until 2011. This work aims to provide a spatially complete view of the vegetation greenness change for all of Canada and Alaska by calculating per-pixel NDVI trend from all available 1984-2012 peak-summer Landsat-5 and -7 surface reflectance data.
Keywords:
SVS >> Landsat
SVS >> NDVI
GCMD >> Location >> Canada
GCMD >> Location >> Alaska
SVS >> Hyperwall
NASA Science >> Earth
GCMD keywords can be found on the Internet with the following citation: Olsen, L.M., G. Major, K. Shein, J. Scialdone, S. Ritz, T. Stevens, M. Morahan, A. Aleman, R. Vogel, S. Leicester, H. Weir, M. Meaux, S. Grebas, C.Solomon, M. Holland, T. Northcutt, R. A. Restrepo, R. Bilodeau, 2013. NASA/Global Change Master Directory (GCMD) Earth Science Keywords. Version 8.0.0.0.0


