Earth
ID: 4438
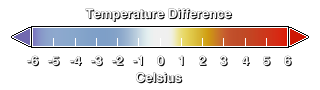
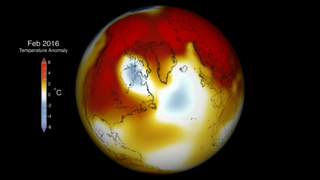
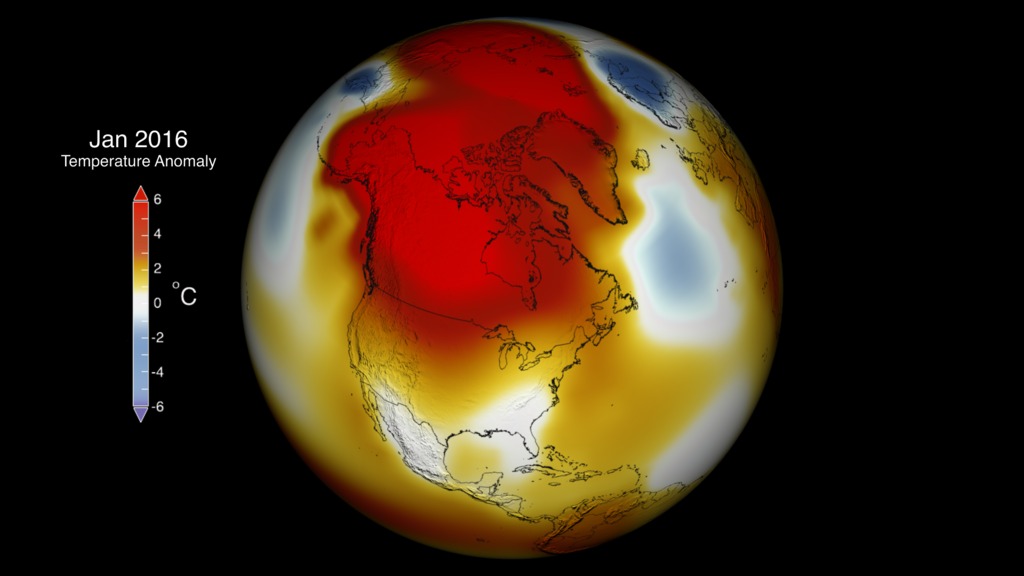
Weather dynamics often affect regional temperatures, so not every region on Earth experienced record average temperatures last year. This data visualization of NASA's Goddard Institute for Space Studies (GISS) Global temperature anomalies for January of 2016 show warmer than averag temperatures in red and colder than average temperatures in blue. The extremely warm arctic temperatures contributed to a new record low sea ice for January.For more information on the GISTEMP, see the GISTEMP analysis website located at: http://data.giss.nasa.gov/gistemp/

Global Temperature Anomalies from January 2016
Used Elsewhere In
Related
Visualization Credits
Gavin A. Schmidt (NASA/GSFC GISS): Lead Scientist
Robert B Schmunk Ph.D. (SIGMA Space Partners, LLC.): Scientist
Reto A. Ruedy Ph.D. (SIGMA Space Partners, LLC.): Scientist
Michelle Handleman (USRA): Lead Producer
Lori Perkins (NASA/GSFC): Lead Data Visualizer
Robert B Schmunk Ph.D. (SIGMA Space Partners, LLC.): Scientist
Reto A. Ruedy Ph.D. (SIGMA Space Partners, LLC.): Scientist
Michelle Handleman (USRA): Lead Producer
Lori Perkins (NASA/GSFC): Lead Data Visualizer
Please give credit for this item to:
NASA/Goddard Space Flight Center Scientific Visualization Studio
Data provided by Robert B. Schmunk (NASA/GSFC GISS)
NASA/Goddard Space Flight Center Scientific Visualization Studio
Data provided by Robert B. Schmunk (NASA/GSFC GISS)
Short URL to share this page:
https://svs.gsfc.nasa.gov/4438
Data Used:
Note: While we identify the data sets used in these visualizations, we do not store any further details nor the data sets themselves on our site.
This item is part of these series:
Early Spring
Global Temperature Anomalies
Keywords:
SVS >> Climate
SVS >> Global Warming
SVS >> HDTV
DLESE >> Physical oceanography
GCMD >> Earth Science >> Biosphere >> Ecological Dynamics >> Extinction
GCMD >> Earth Science >> Climate Indicators >> Teleconnections >> El Nino Southern Oscillation
GCMD >> Earth Science >> Oceans >> Coastal Processes >> Sea Level Rise
SVS >> Model Data
SVS >> Hyperwall
SVS >> iPod
SVS >> Science On a Sphere
NASA Science >> Earth
NASA Earth Science Focus Areas >> Climate Variability and Change
GCMD keywords can be found on the Internet with the following citation: Olsen, L.M., G. Major, K. Shein, J. Scialdone, S. Ritz, T. Stevens, M. Morahan, A. Aleman, R. Vogel, S. Leicester, H. Weir, M. Meaux, S. Grebas, C.Solomon, M. Holland, T. Northcutt, R. A. Restrepo, R. Bilodeau, 2013. NASA/Global Change Master Directory (GCMD) Earth Science Keywords. Version 8.0.0.0.0
https://svs.gsfc.nasa.gov/4438
Data Used:
GISS Surface Temperature Analysis (GISTEMP)/GISTEMP
Model - NASA/GISSThis item is part of these series:
Early Spring
Global Temperature Anomalies
Keywords:
SVS >> Climate
SVS >> Global Warming
SVS >> HDTV
DLESE >> Physical oceanography
GCMD >> Earth Science >> Biosphere >> Ecological Dynamics >> Extinction
GCMD >> Earth Science >> Climate Indicators >> Teleconnections >> El Nino Southern Oscillation
GCMD >> Earth Science >> Oceans >> Coastal Processes >> Sea Level Rise
SVS >> Model Data
SVS >> Hyperwall
SVS >> iPod
SVS >> Science On a Sphere
NASA Science >> Earth
NASA Earth Science Focus Areas >> Climate Variability and Change
GCMD keywords can be found on the Internet with the following citation: Olsen, L.M., G. Major, K. Shein, J. Scialdone, S. Ritz, T. Stevens, M. Morahan, A. Aleman, R. Vogel, S. Leicester, H. Weir, M. Meaux, S. Grebas, C.Solomon, M. Holland, T. Northcutt, R. A. Restrepo, R. Bilodeau, 2013. NASA/Global Change Master Directory (GCMD) Earth Science Keywords. Version 8.0.0.0.0


