Earth
ID: 4354
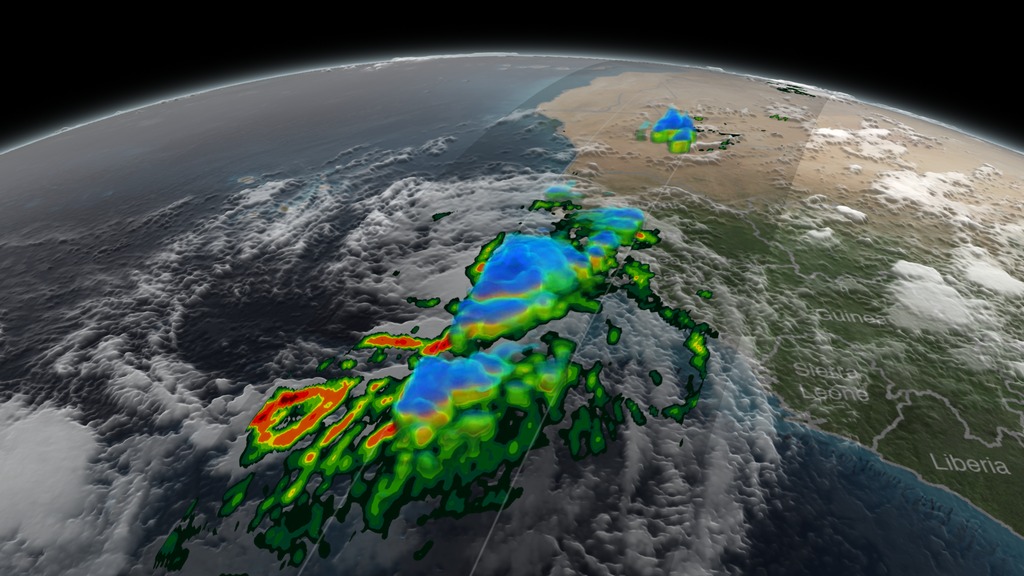
The Global Precipitation Measurement (GPM) mission core satellite passed over Tropical Storm Fred as it was developing in the Eastern Atlantic early August 30th and saw "hot towers" in the storm, which hinted that the storm was intensifying.
Fred became the first Cape Verde hurricane of the 2015 Atlantic season when it was upgraded from a tropical storm on August 31, 2015 at 0600 UTC (2 a.m. EDT). The GPM core observatory satellite flew over on August 30, 2015 at 0236 UTC when Fred was forming from a tropical wave that moved off the African coast. Rainfall was measured by GPM's Dual-Frequency Precipitation Radar (DPR) at the extreme rate of close to 128 mm (5.0 inches) per hour. Rainfall in towering convective storms at Fred's center of circulation were providing the energy necessary for intensification into a hurricane. Three dimensional reflectivity data from GPM's DPR showed that these "hot towers" had storm top heights reaching to 16.2 km (10.0 miles).
A "hot tower" is a tall cumulonimbus cloud that reaches at least to the top of the troposphere, the lowest layer of the atmosphere. It extends approximately 9 miles/14.5 km high in the tropics. These towers are called "hot" because they rise to such altitude due to the large amount of latent heat. Water vapor releases this latent heat as it condenses into liquid. Those towering thunderstorms have the potential for heavy rain. NASA research shows that a tropical cyclone with a hot tower in its eyewall was twice as likely to intensify within six or more hours, than a cyclone that lacked a hot tower.


Tropical Storm Fred
Fred became the first Cape Verde hurricane of the 2015 Atlantic season when it was upgraded from a tropical storm on August 31, 2015 at 0600 UTC (2 a.m. EDT). The GPM core observatory satellite flew over on August 30, 2015 at 0236 UTC when Fred was forming from a tropical wave that moved off the African coast. Rainfall was measured by GPM's Dual-Frequency Precipitation Radar (DPR) at the extreme rate of close to 128 mm (5.0 inches) per hour. Rainfall in towering convective storms at Fred's center of circulation were providing the energy necessary for intensification into a hurricane. Three dimensional reflectivity data from GPM's DPR showed that these "hot towers" had storm top heights reaching to 16.2 km (10.0 miles).
A "hot tower" is a tall cumulonimbus cloud that reaches at least to the top of the troposphere, the lowest layer of the atmosphere. It extends approximately 9 miles/14.5 km high in the tropics. These towers are called "hot" because they rise to such altitude due to the large amount of latent heat. Water vapor releases this latent heat as it condenses into liquid. Those towering thunderstorms have the potential for heavy rain. NASA research shows that a tropical cyclone with a hot tower in its eyewall was twice as likely to intensify within six or more hours, than a cyclone that lacked a hot tower.
Visualization Credits
Alex Kekesi (Global Science and Technology, Inc.): Lead Visualizer
Gail Skofronick Jackson (NASA/GSFC): Lead Scientist
George Huffman (NASA/GSFC): Lead Scientist
Dalia B Kirschbaum (NASA/GSFC): Lead Scientist
Rani Gran (NASA/GSFC): Producer
Ryan Fitzgibbons (USRA): Lead Producer
Rob Gutro (NASA/GSFC): Writer
Gail Skofronick Jackson (NASA/GSFC): Lead Scientist
George Huffman (NASA/GSFC): Lead Scientist
Dalia B Kirschbaum (NASA/GSFC): Lead Scientist
Rani Gran (NASA/GSFC): Producer
Ryan Fitzgibbons (USRA): Lead Producer
Rob Gutro (NASA/GSFC): Writer
Please give credit for this item to:
NASA's Scientific Visualization Studio
NASA's Scientific Visualization Studio
Short URL to share this page:
https://svs.gsfc.nasa.gov/4354
Mission:
Global Precipitation Measurement (GPM)
Data Used:
Note: While we identify the data sets used in these visualizations, we do not store any further details nor the data sets themselves on our site.
This item is part of this series:
GPM Animations
Keywords:
DLESE >> Atmospheric science
SVS >> Tropical Storm
GCMD >> Earth Science >> Atmosphere >> Precipitation >> Rain
NASA Science >> Earth
GCMD keywords can be found on the Internet with the following citation: Olsen, L.M., G. Major, K. Shein, J. Scialdone, S. Ritz, T. Stevens, M. Morahan, A. Aleman, R. Vogel, S. Leicester, H. Weir, M. Meaux, S. Grebas, C.Solomon, M. Holland, T. Northcutt, R. A. Restrepo, R. Bilodeau, 2013. NASA/Global Change Master Directory (GCMD) Earth Science Keywords. Version 8.0.0.0.0
https://svs.gsfc.nasa.gov/4354
Mission:
Global Precipitation Measurement (GPM)
Data Used:
GPM/DPR/Ku also referred to as: Volumetric Precipitation data
Observed Data - JAXA - 8/30/2015 02:36Z
Credit:
Data provided by the joint NASA/JAXA GPM mission.
Data provided by the joint NASA/JAXA GPM mission.
GPM/GMI/Surface Precipitation also referred to as: Rain Rates
8/30/2015 02:36Z
Credit:
Data provided by the joint NASA/JAXA GPM mission.
Data provided by the joint NASA/JAXA GPM mission.
This item is part of this series:
GPM Animations
Keywords:
DLESE >> Atmospheric science
SVS >> Tropical Storm
GCMD >> Earth Science >> Atmosphere >> Precipitation >> Rain
NASA Science >> Earth
GCMD keywords can be found on the Internet with the following citation: Olsen, L.M., G. Major, K. Shein, J. Scialdone, S. Ritz, T. Stevens, M. Morahan, A. Aleman, R. Vogel, S. Leicester, H. Weir, M. Meaux, S. Grebas, C.Solomon, M. Holland, T. Northcutt, R. A. Restrepo, R. Bilodeau, 2013. NASA/Global Change Master Directory (GCMD) Earth Science Keywords. Version 8.0.0.0.0


