Sun
ID: 4279
On July 12, 2012, at 12:11 EDT, a solar reconnection event initiated a solar flare, and then a coronal mass ejection (CME) (see Big Sunspot 1520 Releases X1.4 Class Flare). Later that month, after solar rotation had carried it so it was directed away from Earth, the same active region would launch a much larger event (see The Carrington-Class CME of 2012).
But back to our original event...
The CME, traveling at 850 miles per hour, headed straight towards Earth and struck Earth's magnetosphere the afternoon of July 14, 2012. The plasma of the CME carried a complex magnetic field, most of it directed southward. But Earth's magnetic field is directed nortward at the outer boundary of the magnetopause. When these two different magnetic fields merge, reconnection can take place, pumping energy from the magnetic fields into energies of the plasma particles.
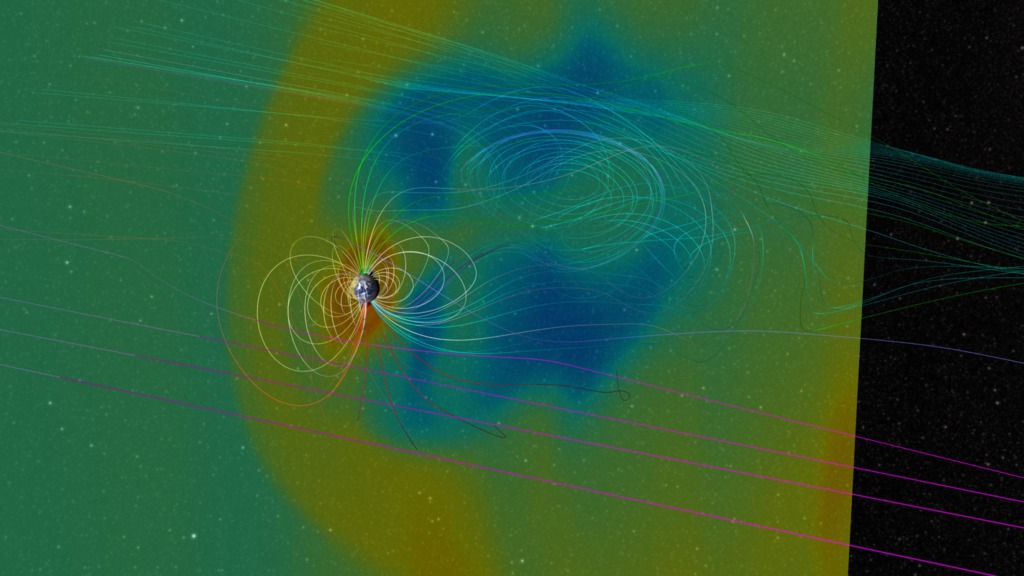
This visualization was generated using data from a BATS-R-US simulation run which was initialized using data from the ACE spacecraft and Earth's magnetic field configuration at the time. The Sun is to the left in these simulations.
Each image frame corresponds to 2 minutes of elapsed time.
Density data is plotted in a 2-dimensional plane sliced through the 3-D dataset. Red is high density,and blue is low density (see color bar for details).
The magnetic field lines are 3-dimensional structures which is more apparent in the oblique and polar views.
As the magnetosphere responses to the CME, we see field lines forming complex structures, and radically change directions. The field has significant structure changes on the sunward side, and the night side of Earth, where reconnection-type events are occurring.
Field line colors represent details of where these structures are connected:
- White field lines are closed
- Green field lines are open from north geographic (south magnetic) pole
- Red field lines are open from south geographic (north magnetic) pole
- Cyan field lines are seeded in the magnetotail. Some are open and some closed.
- Magenta field lines are seeded ahead of the magnetopause.

Magnetospheric Reconnection - July 2012
But back to our original event...
The CME, traveling at 850 miles per hour, headed straight towards Earth and struck Earth's magnetosphere the afternoon of July 14, 2012. The plasma of the CME carried a complex magnetic field, most of it directed southward. But Earth's magnetic field is directed nortward at the outer boundary of the magnetopause. When these two different magnetic fields merge, reconnection can take place, pumping energy from the magnetic fields into energies of the plasma particles.
This visualization was generated using data from a BATS-R-US simulation run which was initialized using data from the ACE spacecraft and Earth's magnetic field configuration at the time. The Sun is to the left in these simulations.
Each image frame corresponds to 2 minutes of elapsed time.
Density data is plotted in a 2-dimensional plane sliced through the 3-D dataset. Red is high density,and blue is low density (see color bar for details).
The magnetic field lines are 3-dimensional structures which is more apparent in the oblique and polar views.
As the magnetosphere responses to the CME, we see field lines forming complex structures, and radically change directions. The field has significant structure changes on the sunward side, and the night side of Earth, where reconnection-type events are occurring.
Field line colors represent details of where these structures are connected:
- White field lines are closed
- Green field lines are open from north geographic (south magnetic) pole
- Red field lines are open from south geographic (north magnetic) pole
- Cyan field lines are seeded in the magnetotail. Some are open and some closed.
- Magenta field lines are seeded ahead of the magnetopause.
Visualization Credits
Tom Bridgman (Global Science and Technology, Inc.): Lead Animator
Laurence Schuler (ADNET Systems, Inc.): Technical Support
Ian Jones (ADNET Systems, Inc.): Technical Support
M. Leila Mays (Catholic University of America): Scientist
Lutz Rastaetter (NASA/GSFC): Lead Scientist
Laurence Schuler (ADNET Systems, Inc.): Technical Support
Ian Jones (ADNET Systems, Inc.): Technical Support
M. Leila Mays (Catholic University of America): Scientist
Lutz Rastaetter (NASA/GSFC): Lead Scientist
Short URL to share this page:
https://svs.gsfc.nasa.gov/4279
Data Used:
Note: While we identify the data sets used in these visualizations, we do not store any further details nor the data sets themselves on our site.
Keywords:
SVS >> Magnetic Reconnection
SVS >> Magnetosphere
NASA Science >> Sun
https://svs.gsfc.nasa.gov/4279
Data Used:
BATS-R-US Magnetosphere Model
Model - Community Coordinated Modeling Center (CCMC) - 2012-07-14T00:00:00 - 2012-07-17T00:00:00
MHD Magnetospheric simulation
Keywords:
SVS >> Magnetic Reconnection
SVS >> Magnetosphere
NASA Science >> Sun


