Earth
ID: 4086
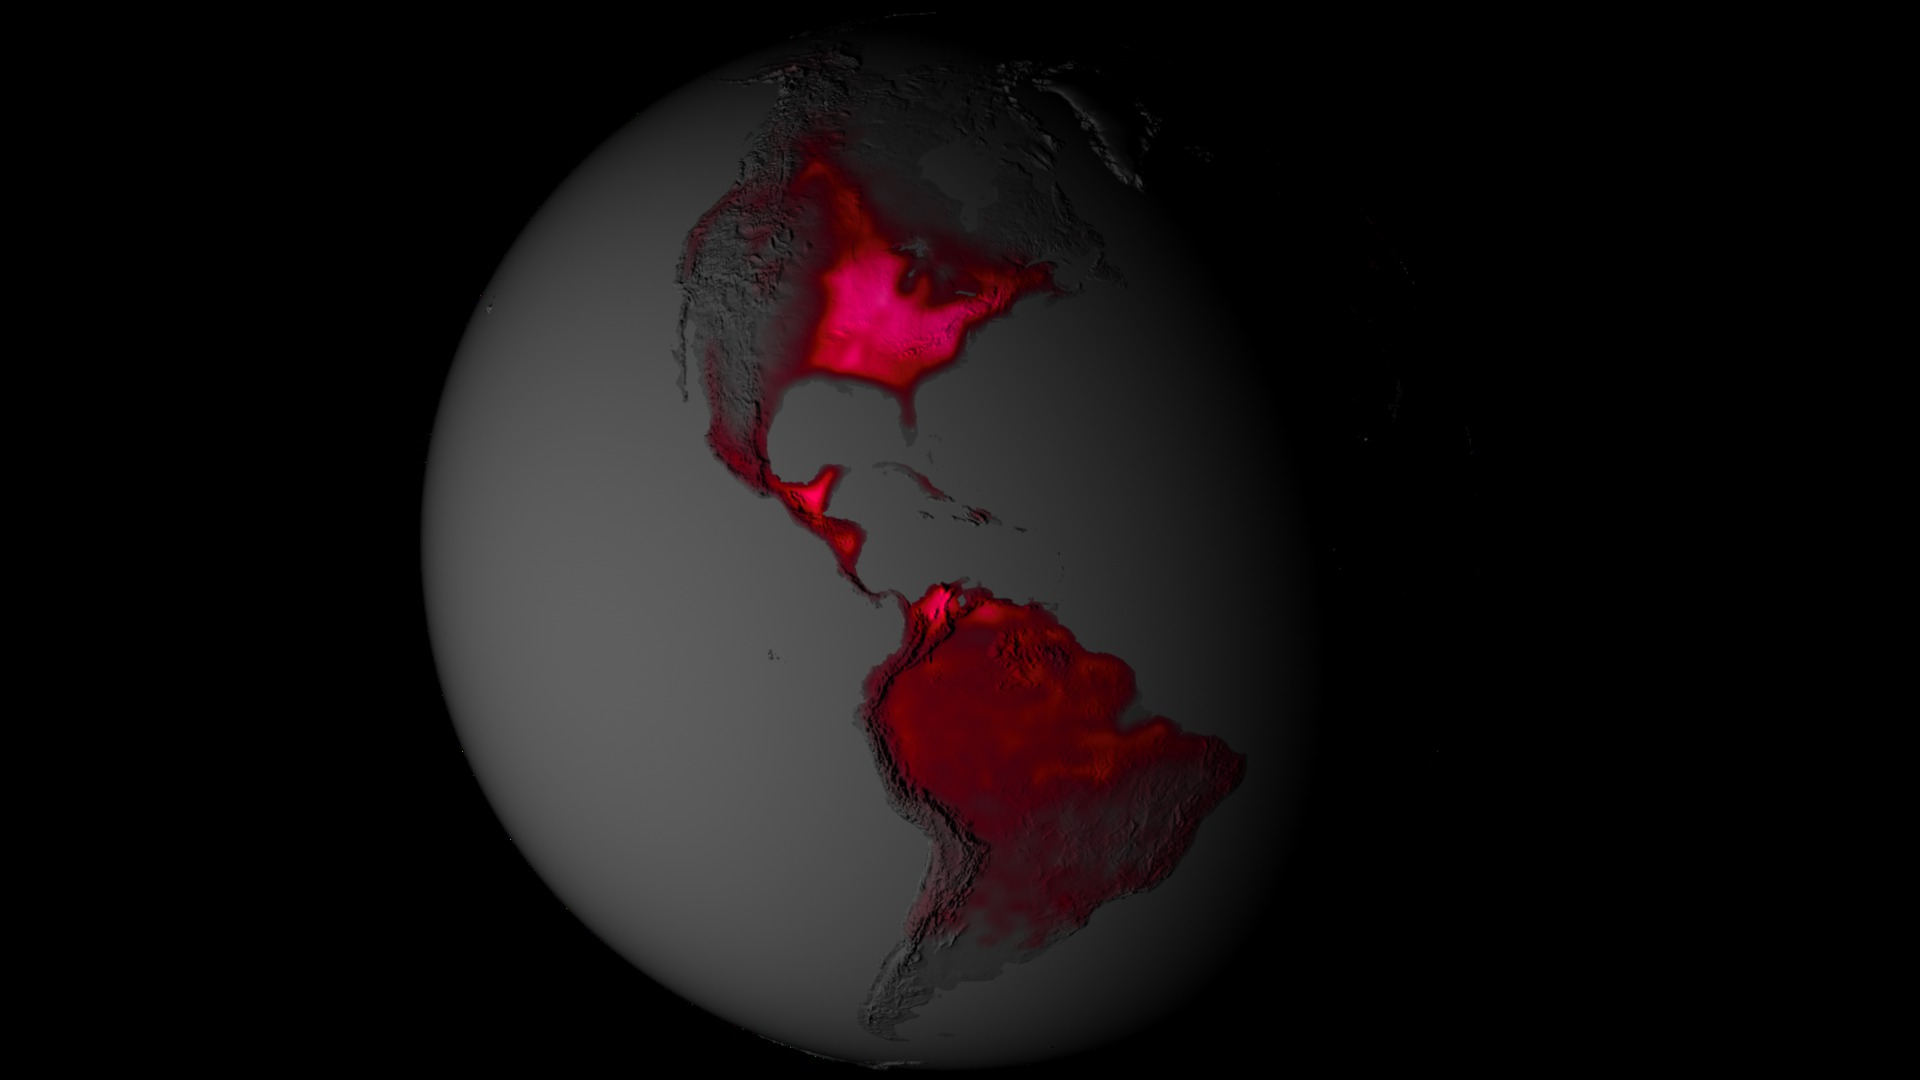
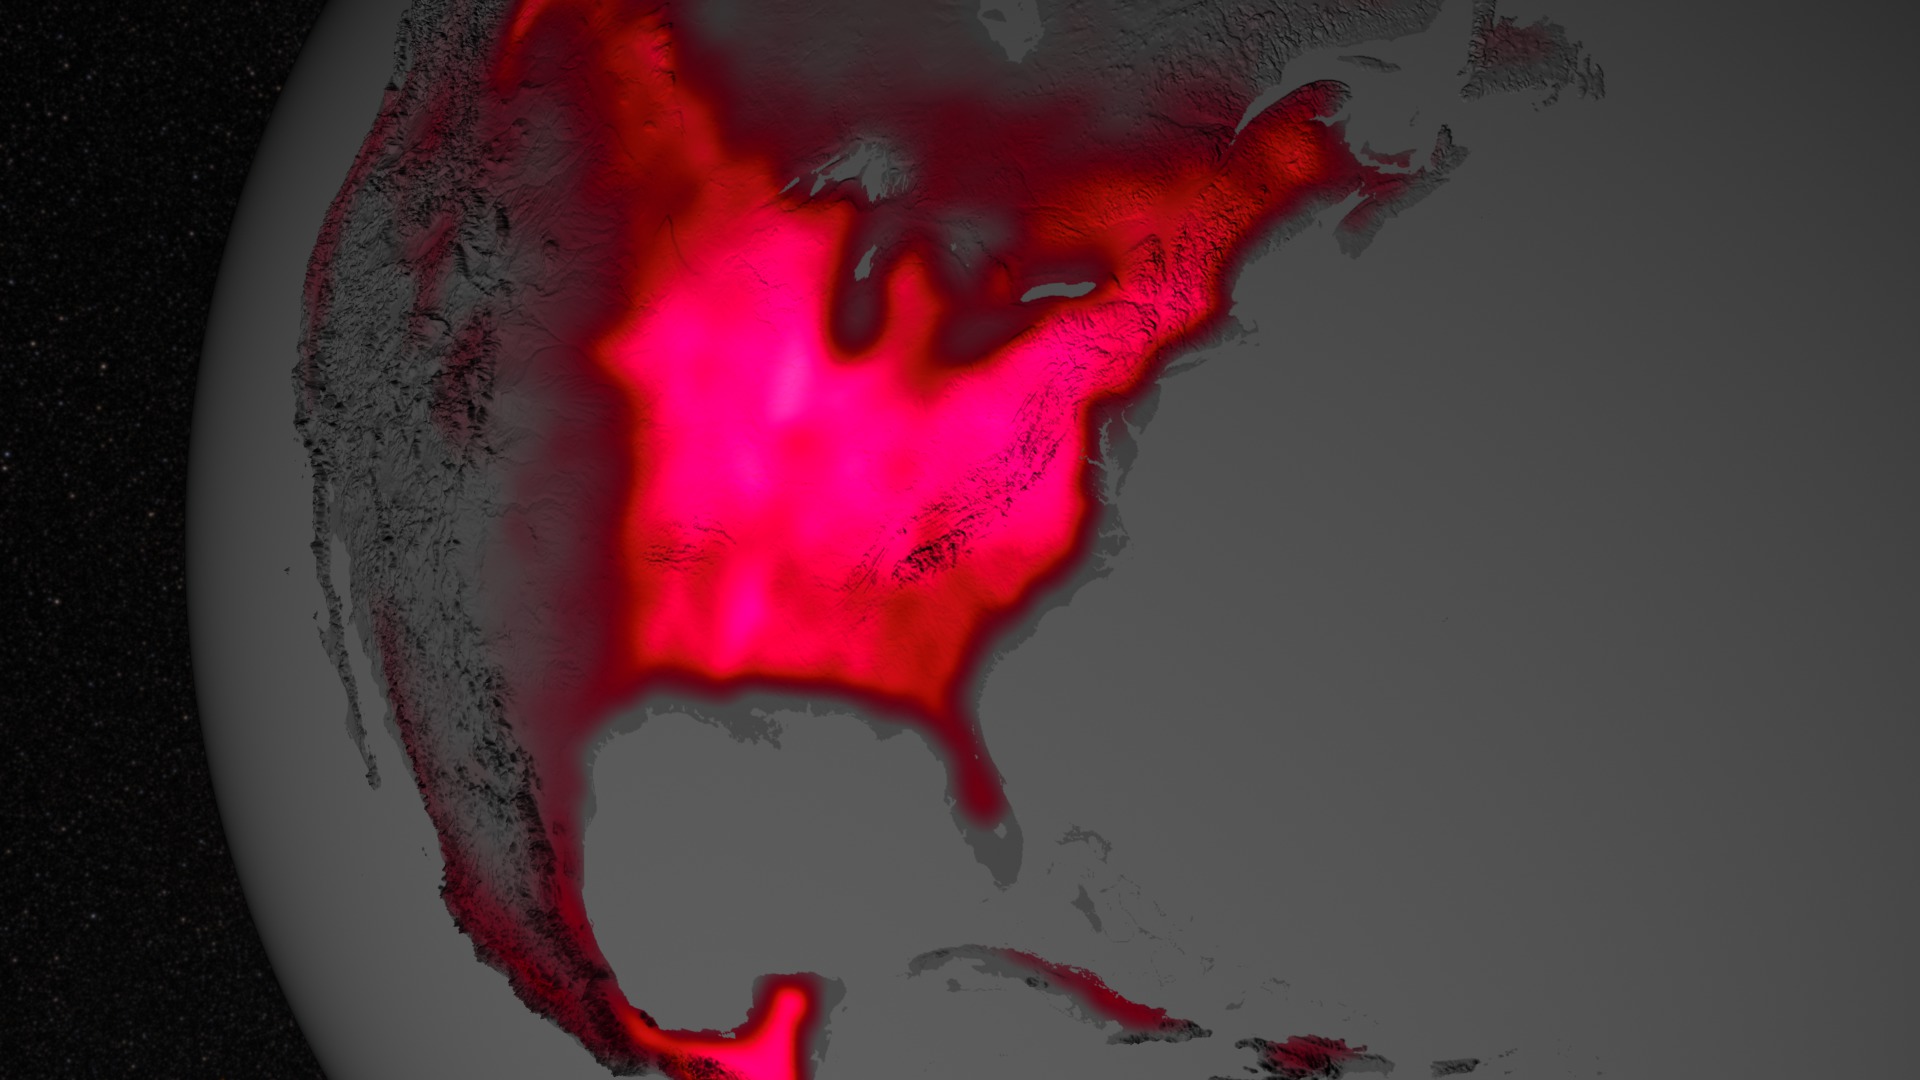
During photosynthesis, plants emit fluorescence – a form of light invisible to the naked eye but detectable by satellites orbiting hundreds of miles above Earth. NASA scientists established a method to turn this satellite data into global maps of the subtle phenomenon in more detail than ever before.

Fluorescence Visualizations in High-Resolution
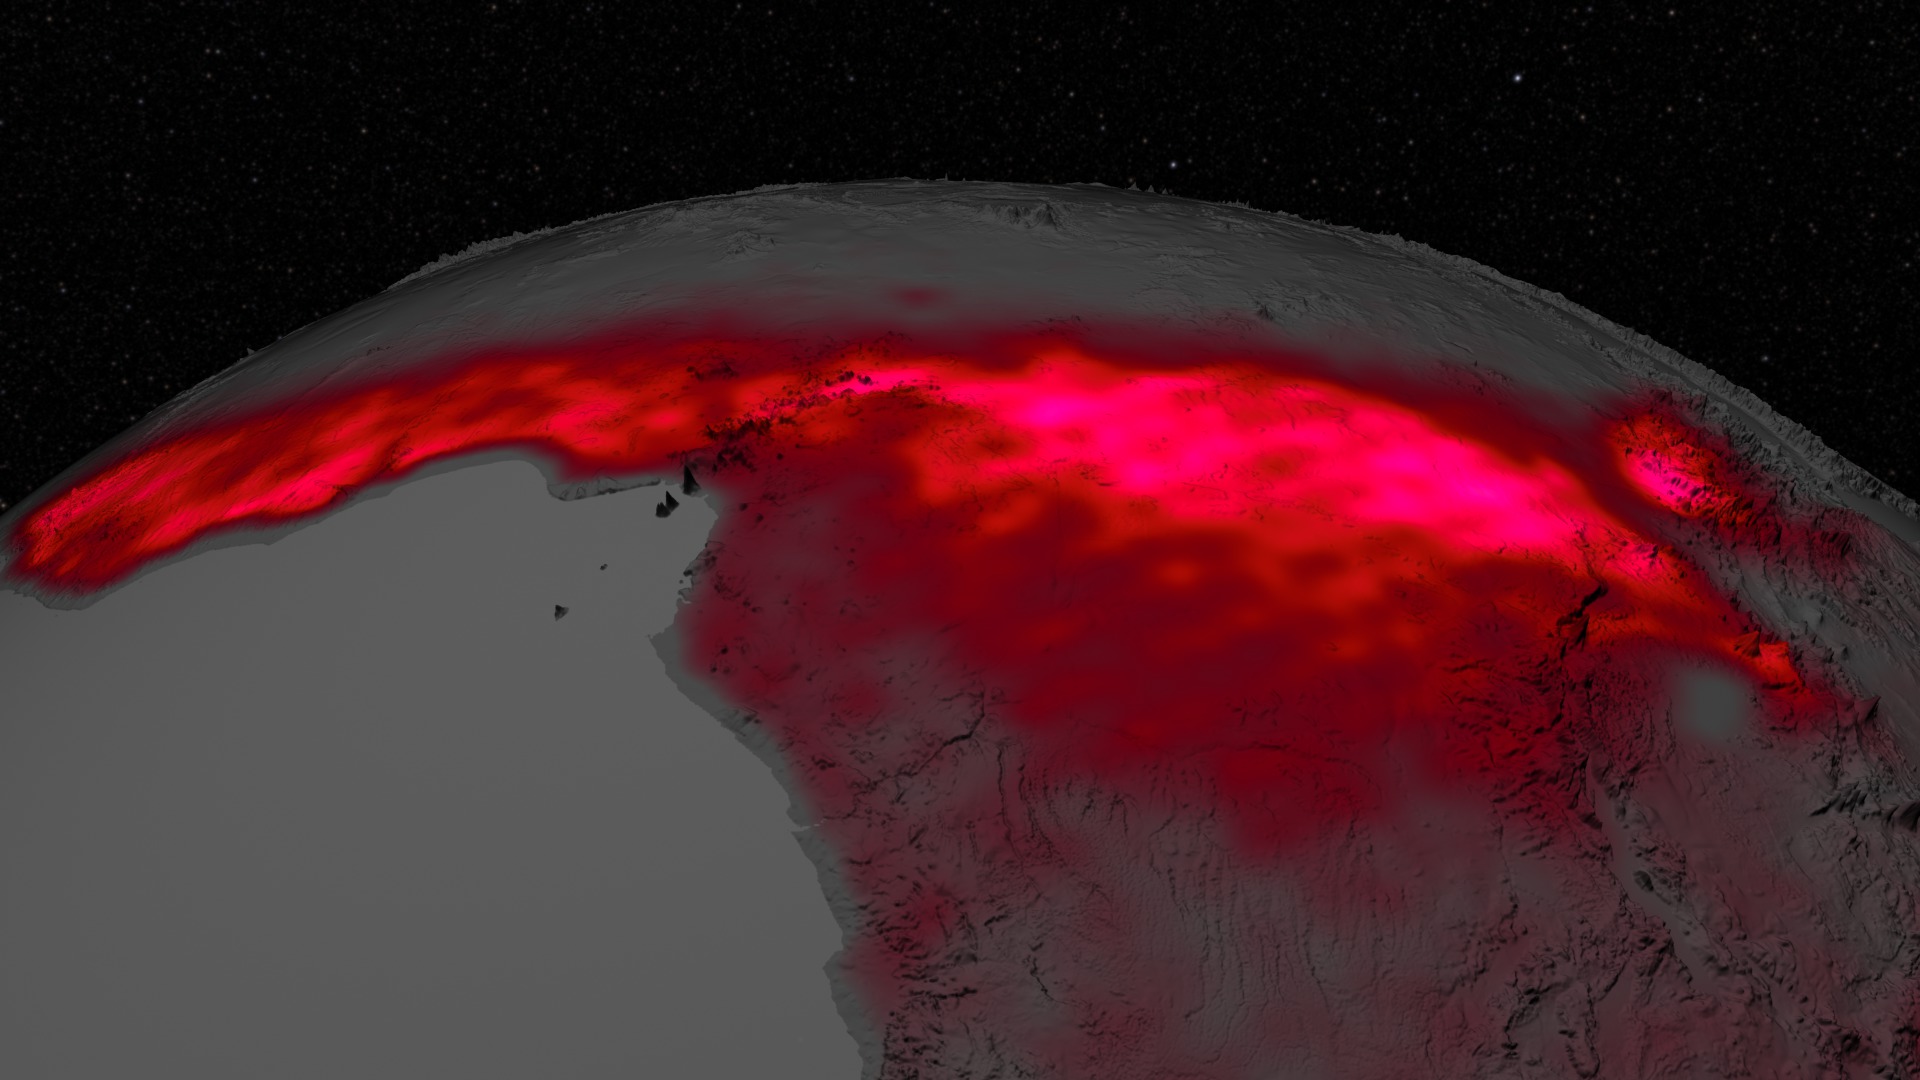
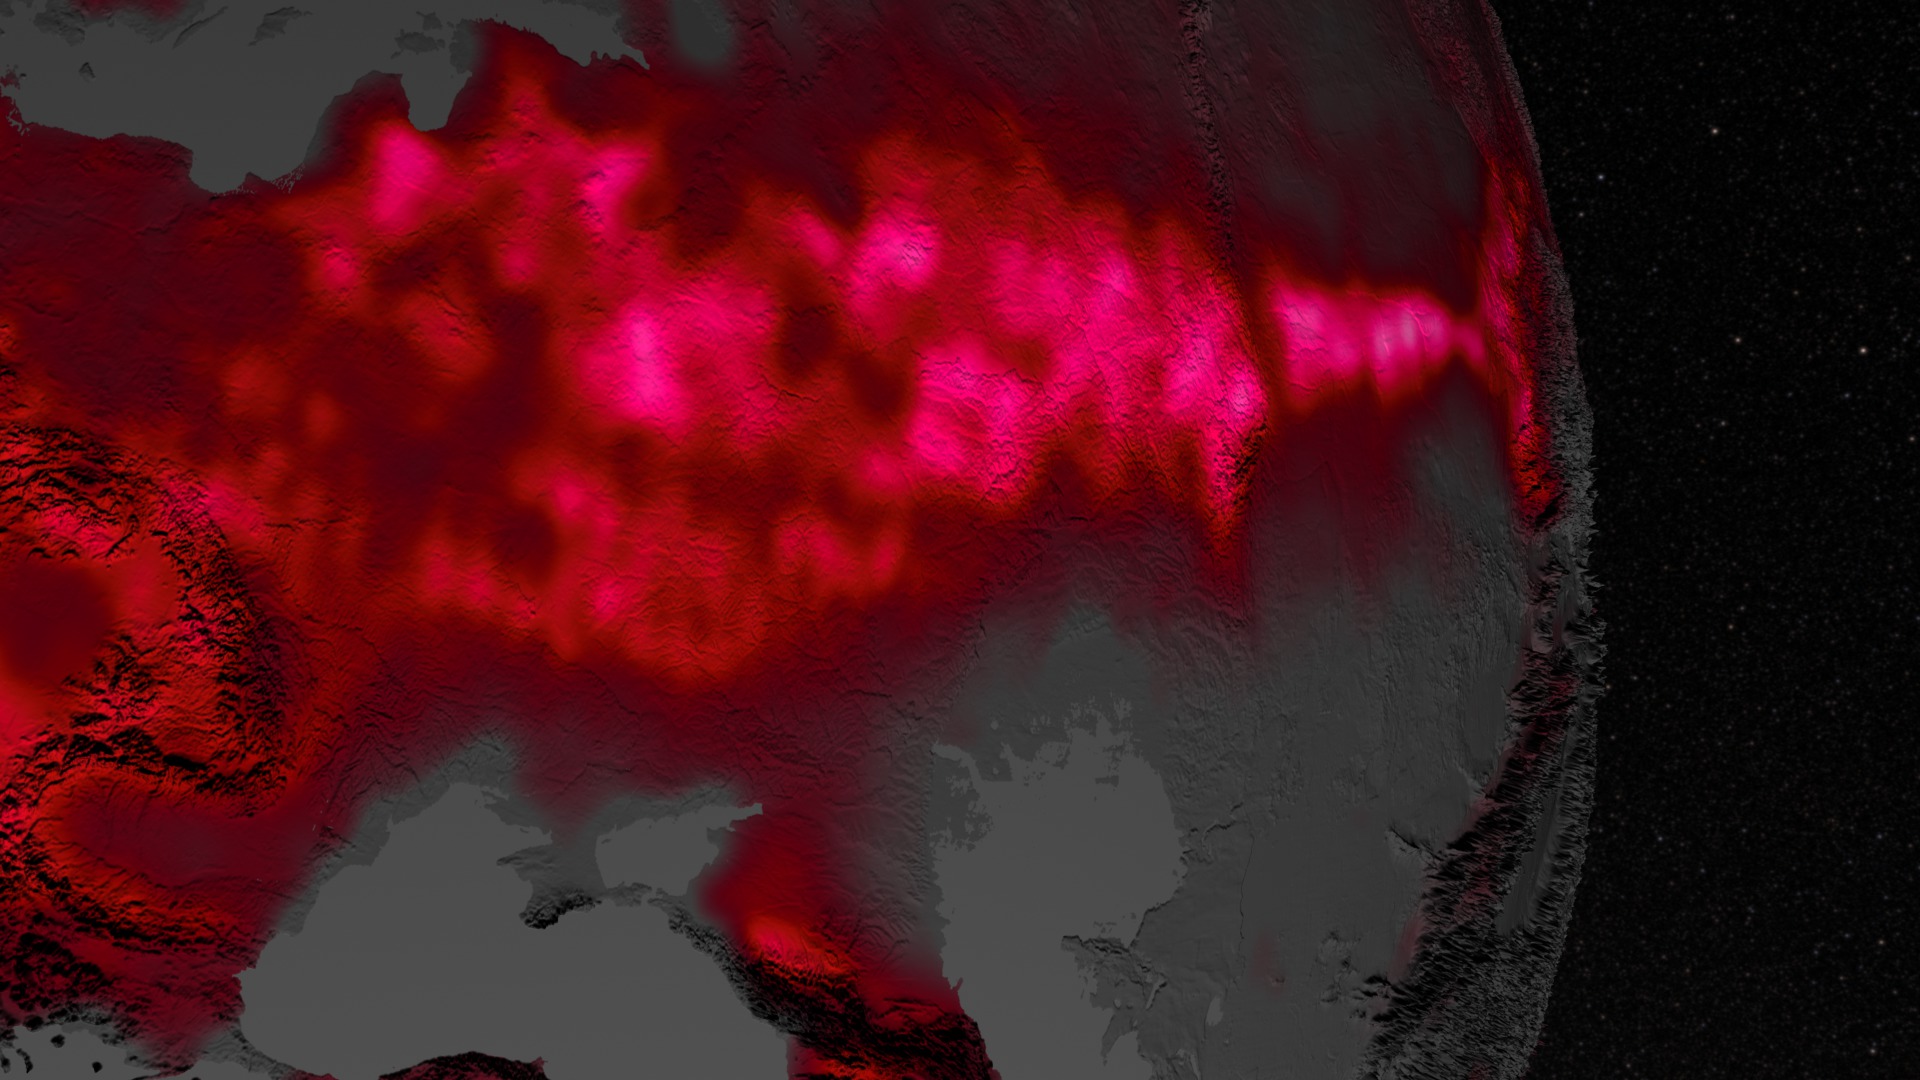
The new maps, released in 2013, provide a 16-fold increase in spatial resolution and a 3-fold increase in temporal resolution over the first proof-of-concept maps released in 2011. This lets scientists use fluorescence to observe, for example, variation in the length of the growing season.
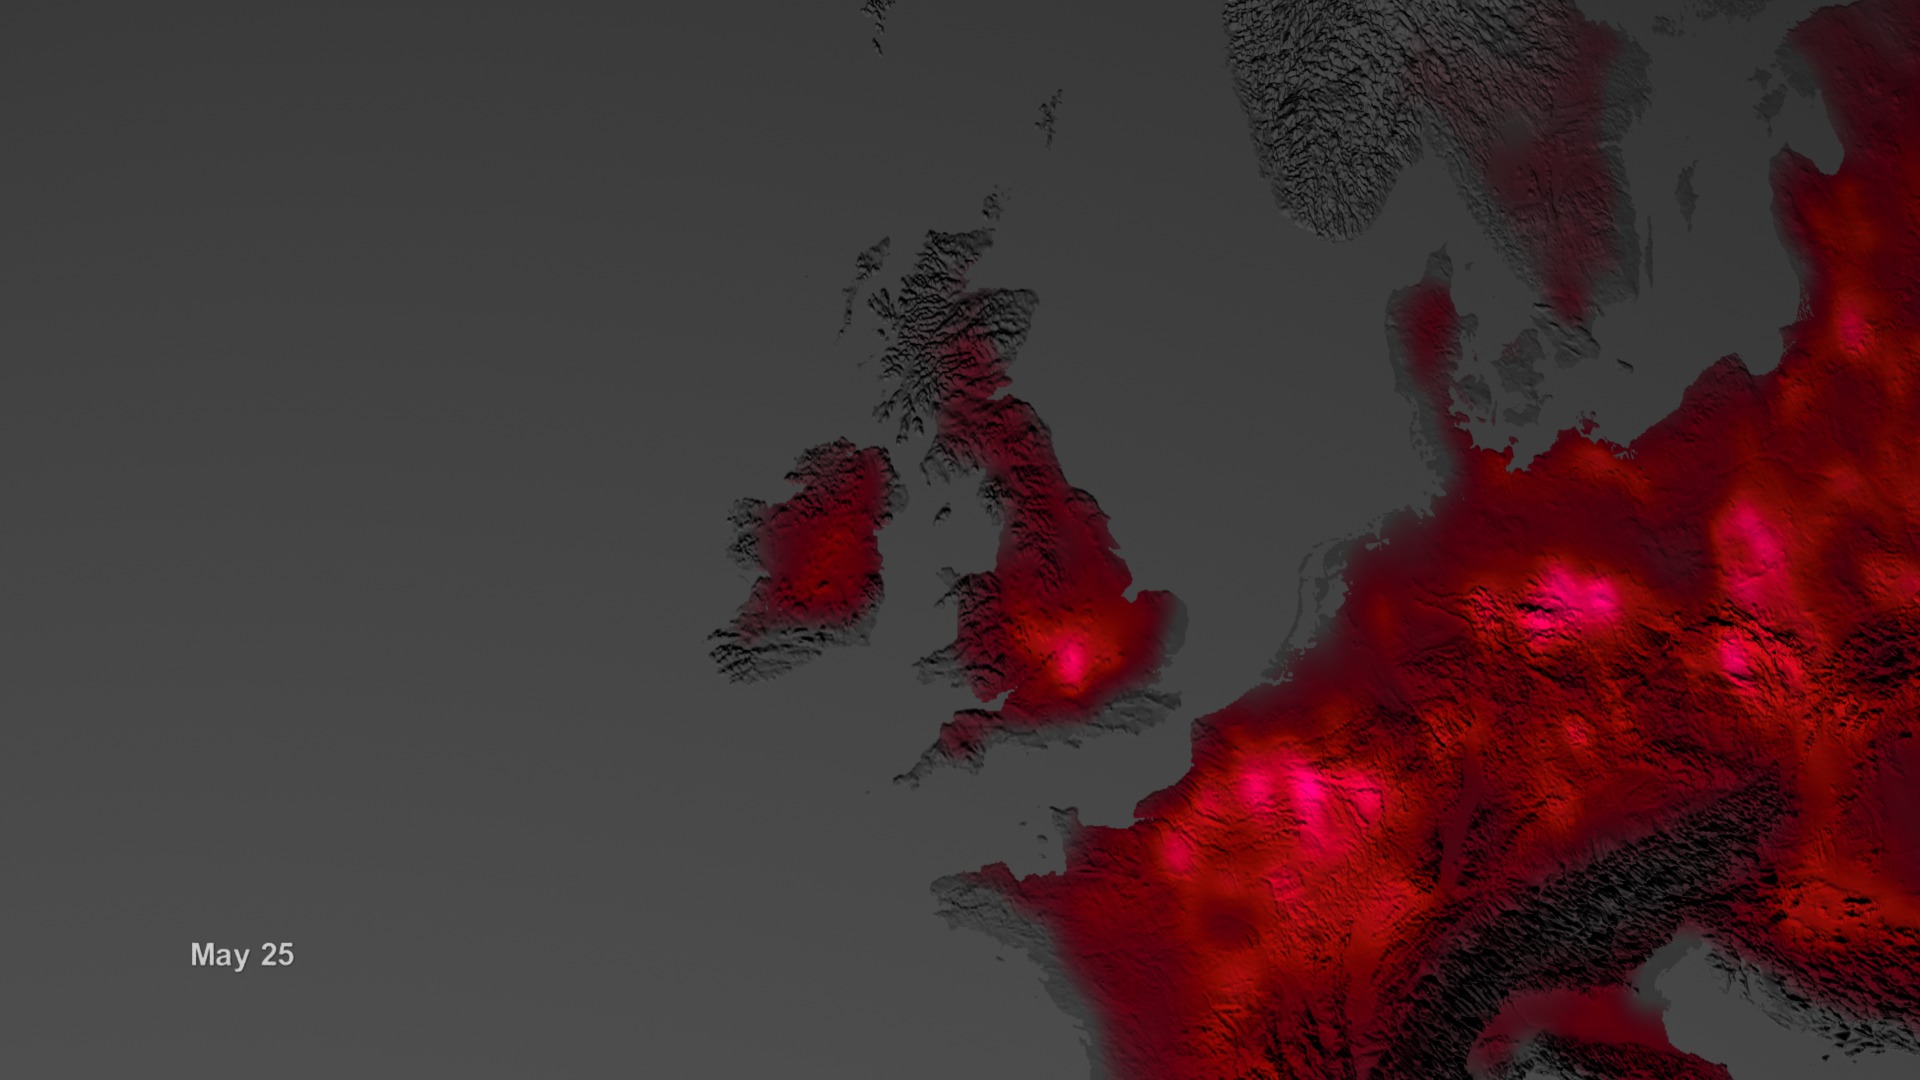
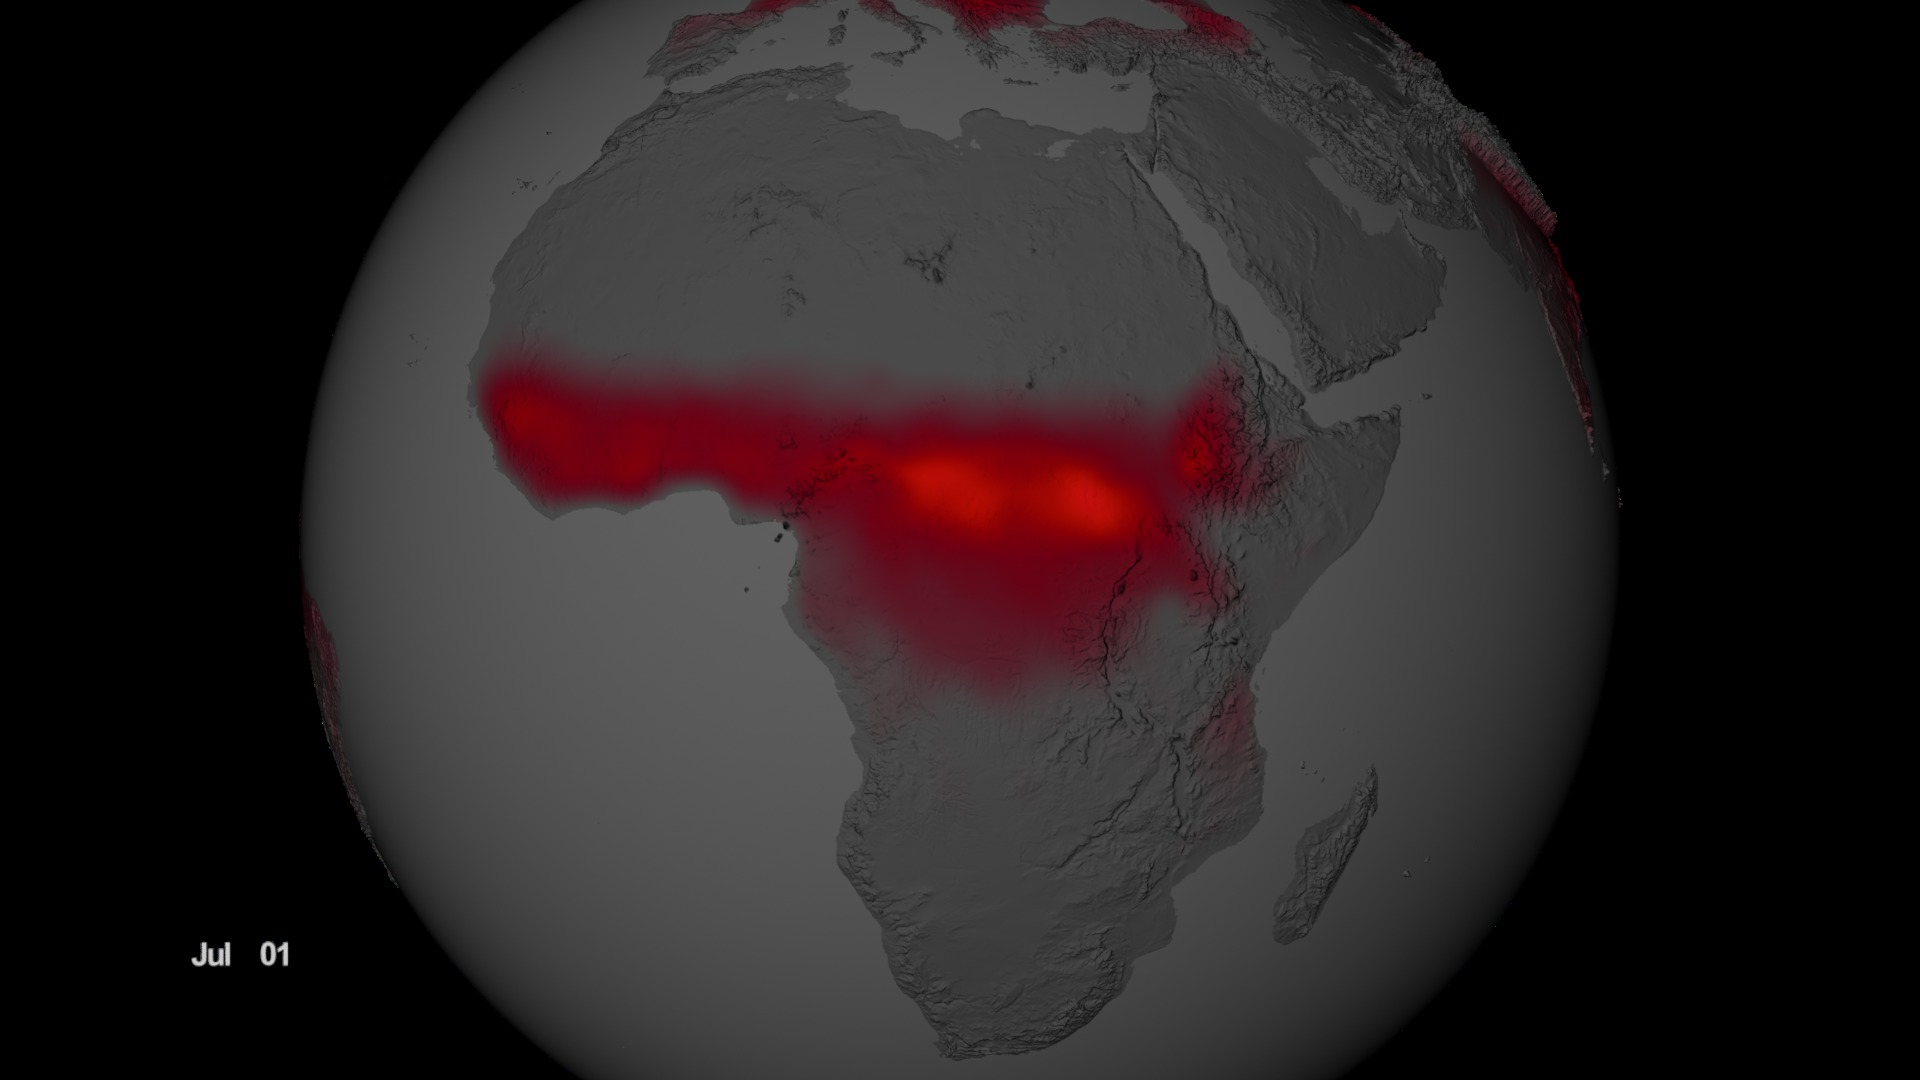
A visualization of the phenomenon shows global land plant fluorescence data collected from 2007 to 2011, combined to depict a single average year. Gray indicates regions with little or no fluorescence; red, pink and white indicate regions of high fluorescence.
Related


Visualization Credits
Greg Shirah (NASA/GSFC): Lead Animator
Kayvon Sharghi (USRA): Producer
Joanna Joiner (NASA/GSFC): Scientist
Kathryn Hansen (Wyle Information Systems): Writer
Kayvon Sharghi (USRA): Producer
Joanna Joiner (NASA/GSFC): Scientist
Kathryn Hansen (Wyle Information Systems): Writer
Please give credit for this item to:
NASA's Goddard Space Flight Center Scientific Visualization Studio
NASA's Goddard Space Flight Center Scientific Visualization Studio
Short URL to share this page:
https://svs.gsfc.nasa.gov/4086
Data Used:
Note: While we identify the data sets used in these visualizations, we do not store any further details nor the data sets themselves on our site.
Keywords:
SVS >> Fluorescent Light
NASA Science >> Earth
https://svs.gsfc.nasa.gov/4086
Data Used:
MetOp/GOME-2/GOME-2 Solar Induced Fluorescence at 740 nm
Observed Data - ESA - 2007 through 2011Keywords:
SVS >> Fluorescent Light
NASA Science >> Earth


