Earth
ID: 3992
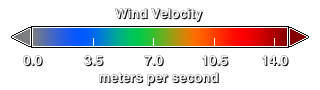
Early in the month of August, 2012, storms in the Arctic affected the motion of the sea ice north of Siberia and Alaska. This animation shows the motion of the winds over the Arctic in conjunction with seasonal melting of the Arctic sea ice from August 1 through September 13, 2012, when the NASA scientists determined that the sea ice reached its annual minimum extent. The surface winds, shown my moving arrows, are colored by the velocity. Slower winds are shown in blue, medium in green and the fast winds are shown in red.

Daily Sea Ice during Aug & Sept 2012 with Winds
Note: Scientists at the National Snow and Ice Data Center, who calculate the sea ice minimum based on a 5-day trailing average, identified September 16 as the date when the lowest minimum extent occurred. NASA scientists who calculate area on each individual day identified September 13th as the date of the minimum sea ice, although there is little difference in size between the two days.
Related

Visualization Credits
Cindy Starr (Global Science and Technology, Inc.): Lead Visualizer
Greg Shirah (NASA/GSFC): Animator
Horace Mitchell (NASA/GSFC): Animator
Jefferson Beck (USRA): Producer
Josefino Comiso (NASA/GSFC): Scientist
Robert Gersten (Wyle Information Systems): Scientist
Laurence Schuler (ADNET Systems, Inc.): Project Support
Ian Jones (ADNET Systems, Inc.): Project Support
Please give credit for this item to:
NASA/Goddard Space Flight Center Scientific Visualization Studio.
Wind data provided by NCEP Reanalysis project at the Earth System Research Laboratory (ESRL) at NOAA's Office of Oceanic and Atmospheric research(NOAA/OAR) from the Physical Sciences Division (PSD) in Boulder, Colorado, USA. For more detail on this data, see their Web site at http://www.esrl.noaa.gov/psd/
The Blue Marble data is courtesy of Reto Stockli (NASA/GSFC).
Short URL to share this page:
https://svs.gsfc.nasa.gov/3992
Data Used:
Note: While we identify the data sets used in these visualizations, we do not store any further details nor the data sets themselves on our site.
Keywords:
DLESE >> Atmospheric science
DLESE >> Cryology
SVS >> HDTV
DLESE >> Physical oceanography
GCMD >> Earth Science >> Cryosphere >> Sea Ice
GCMD >> Earth Science >> Oceans >> Sea Ice
GCMD >> Earth Science >> Cryosphere >> Sea Ice >> Ice Growth/Melt
GCMD >> Earth Science >> Cryosphere >> Sea Ice >> Sea Ice Concentration
GCMD >> Earth Science >> Cryosphere >> Sea Ice >> Sea Ice Motion
GCMD >> Earth Science >> Oceans >> Ocean Circulation >> Wind-driven Circulation
GCMD >> Earth Science >> Oceans >> Ocean Winds >> Surface Winds
GCMD >> Earth Science >> Oceans >> Sea Ice >> Sea Ice Concentration
GCMD >> Earth Science >> Oceans >> Sea Ice >> Sea Ice Motion
SVS >> Hyperwall
SVS >> Atmosphere >> Winds >> Circulation
SVS >> Wind Patterns
SVS >> Hydrosphere >> Sea Ice
NASA Science >> Earth
GCMD keywords can be found on the Internet with the following citation: Olsen, L.M., G. Major, K. Shein, J. Scialdone, S. Ritz, T. Stevens, M. Morahan, A. Aleman, R. Vogel, S. Leicester, H. Weir, M. Meaux, S. Grebas, C.Solomon, M. Holland, T. Northcutt, R. A. Restrepo, R. Bilodeau, 2013. NASA/Global Change Master Directory (GCMD) Earth Science Keywords. Version 8.0.0.0.0
https://svs.gsfc.nasa.gov/3992
Data Used:
Comiso's Daily Sea Ice Concentration
Data Compilation - NASA/GSFC - 08/01/2012 - 09/13/2012also referred to as: Surface Flux
Model - NOAA/OAR/ESRL PSD - 08/01/2012 - 09/13/2012
Wind data provided by NCEP Reanalysis project at the Earth System Research Laboratory Physical Sciences Division of NOAA's Office of Oceanic and Atmospheric Research, in Boulder, Colorado, USA.
Keywords:
DLESE >> Atmospheric science
DLESE >> Cryology
SVS >> HDTV
DLESE >> Physical oceanography
GCMD >> Earth Science >> Cryosphere >> Sea Ice
GCMD >> Earth Science >> Oceans >> Sea Ice
GCMD >> Earth Science >> Cryosphere >> Sea Ice >> Ice Growth/Melt
GCMD >> Earth Science >> Cryosphere >> Sea Ice >> Sea Ice Concentration
GCMD >> Earth Science >> Cryosphere >> Sea Ice >> Sea Ice Motion
GCMD >> Earth Science >> Oceans >> Ocean Circulation >> Wind-driven Circulation
GCMD >> Earth Science >> Oceans >> Ocean Winds >> Surface Winds
GCMD >> Earth Science >> Oceans >> Sea Ice >> Sea Ice Concentration
GCMD >> Earth Science >> Oceans >> Sea Ice >> Sea Ice Motion
SVS >> Hyperwall
SVS >> Atmosphere >> Winds >> Circulation
SVS >> Wind Patterns
SVS >> Hydrosphere >> Sea Ice
NASA Science >> Earth
GCMD keywords can be found on the Internet with the following citation: Olsen, L.M., G. Major, K. Shein, J. Scialdone, S. Ritz, T. Stevens, M. Morahan, A. Aleman, R. Vogel, S. Leicester, H. Weir, M. Meaux, S. Grebas, C.Solomon, M. Holland, T. Northcutt, R. A. Restrepo, R. Bilodeau, 2013. NASA/Global Change Master Directory (GCMD) Earth Science Keywords. Version 8.0.0.0.0


