Modelling Weather: Wind, Clouds, and T2M.
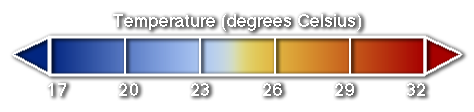
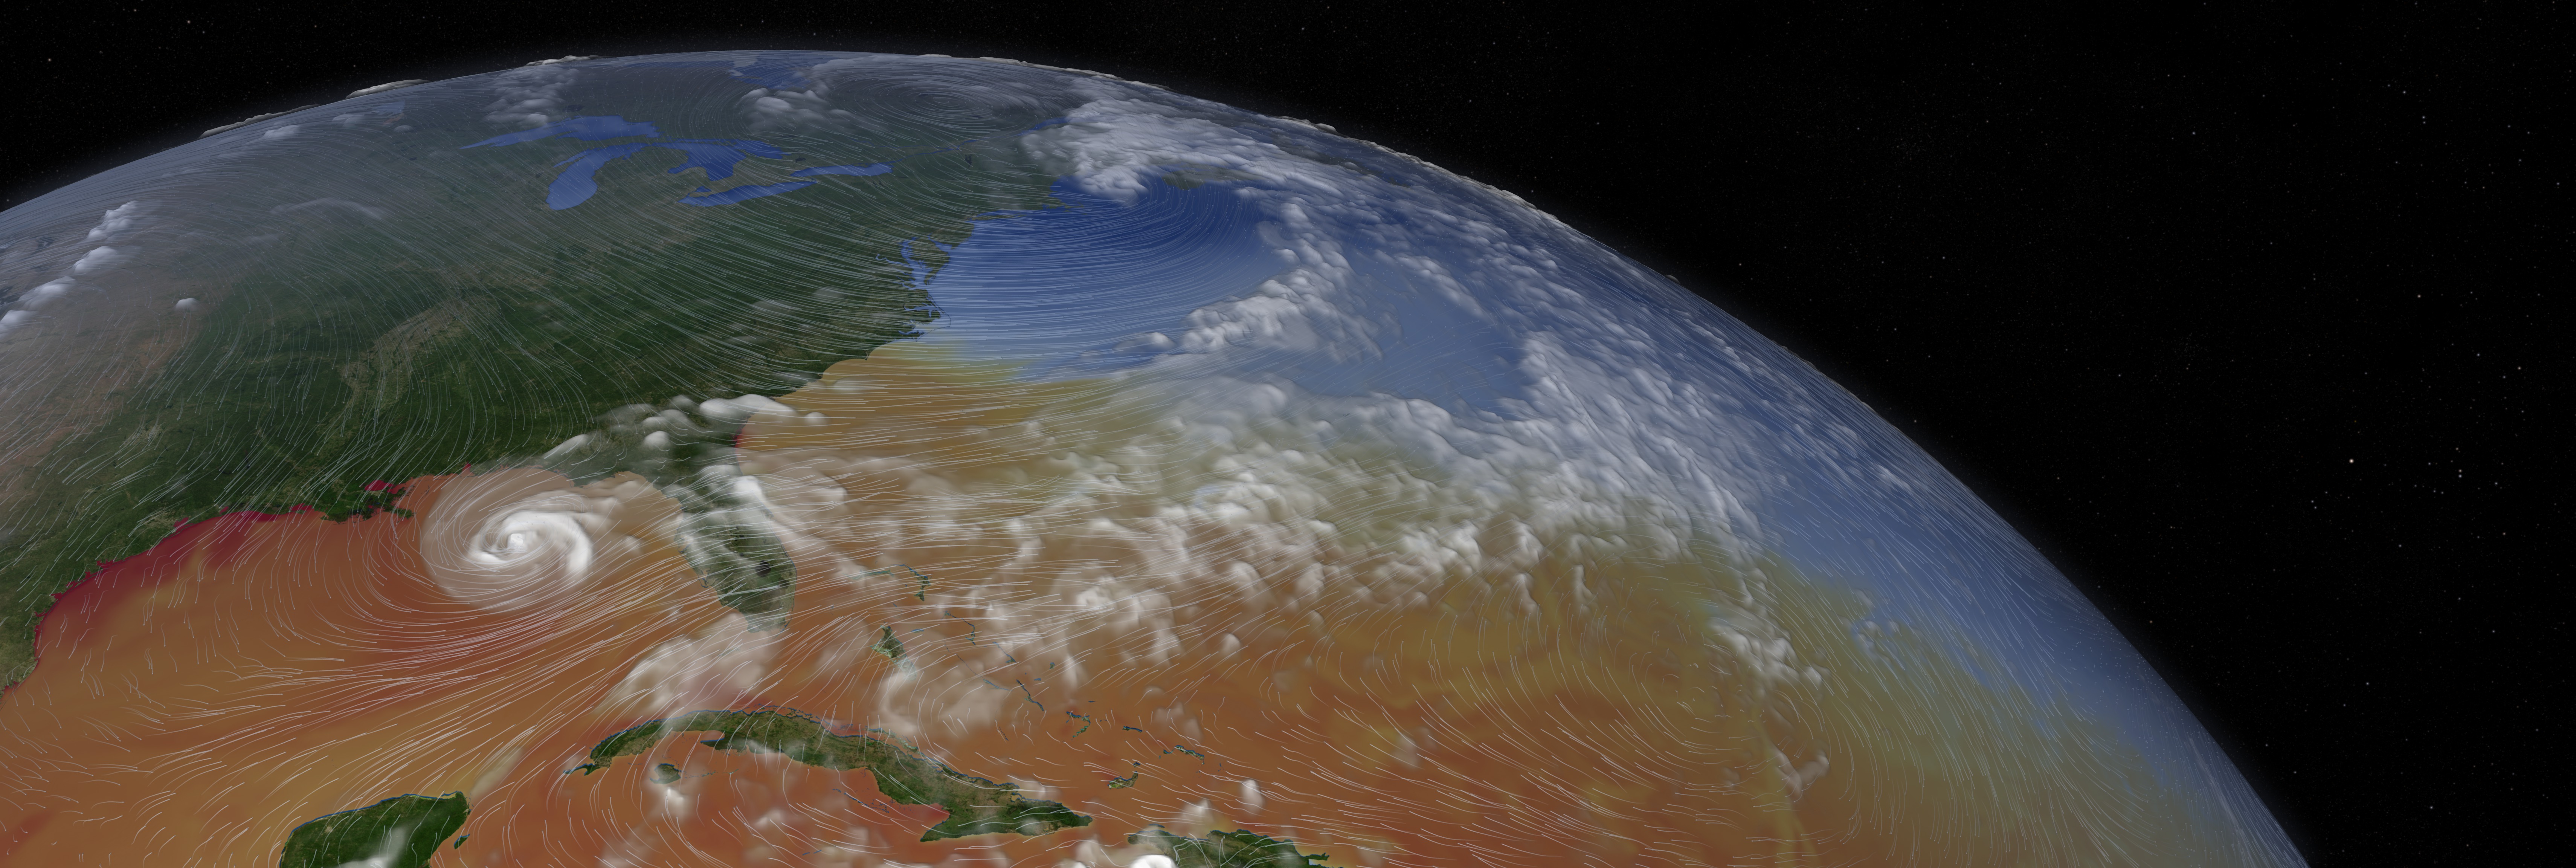
The ocean color layer ranging from blue to orange depict air temperatures 2 meters (T2M) above sea level. Since Sea Surface Temperatures (SST) are typically measured at sea level and below, the T2M model output behaves somewhat differently. Nonetheless, it is a reasonable proxy to SST.
Landcover information is taken from the Next Generation Blue Marble dataset.
Sea Ice is depicted as solid white and clouds are shades of white.
The wind layer is depicted as flowing white arrows.
This project was developed in support of a hyperwall show titled "Pursuit of Light" which is scheduled to premiere on April 19, 2012 at the Smithsonian Uvar-Hazy Center during the space shuttle Discovery Transfer Ceremony on a Jumbotron. The hyperwall itself is a multi-screen display system that allows for the display of very high resolution images beyond current 1080p HDTV standards, allowing for much greater detail to be shown on much larger screens. Please click here for more information on NASA's travelling hyperwall.


Visualization Credits
Greg Shirah (NASA/GSFC): Animator
William Putman (NASA/GSFC): Scientist
NASA/Goddard Space Flight Center Scientific Visualization Studio
Putman, W. M., and M. Suarez (2011), Cloud-system resolving simulations with the NASA Goddard Earth Observing System global atmospheric model (GEOS-5), Geophys. Res. Lett., 38, L16809, doi:10.1029/2011GL048438.
Short URL to share this page:
https://svs.gsfc.nasa.gov/3935
Data Used:
GEOS Atmospheric Model
Model - NASA GMAO - 6/1/2005 - 6/25/2005This item is part of this series:
Hyperwall
Keywords:
DLESE >> Atmospheric science
SVS >> Cloud Cover
SVS >> HDTV
DLESE >> Physical oceanography
GCMD >> Earth Science >> Atmosphere >> Clouds
GCMD >> Earth Science >> Atmosphere >> Atmospheric Winds >> Wind Shear
GCMD >> Earth Science >> Atmosphere >> Clouds >> Cloud Amount/Frequency
GCMD >> Earth Science >> Atmosphere >> Clouds >> Cloud Asymmetry
GCMD >> Earth Science >> Atmosphere >> Clouds >> Cloud Forcing
GCMD >> Earth Science >> Oceans >> Ocean Circulation >> Wind-driven Circulation
GCMD >> Earth Science >> Oceans >> Ocean Temperature >> Sea Surface Temperature
GCMD >> Earth Science >> Oceans >> Ocean Winds >> Wind Shear
SVS >> Hyperwall
SVS >> Atmosphere >> Winds >> Circulation
SVS >> Wind Patterns
NASA Science >> Earth
GCMD keywords can be found on the Internet with the following citation: Olsen, L.M., G. Major, K. Shein, J. Scialdone, S. Ritz, T. Stevens, M. Morahan, A. Aleman, R. Vogel, S. Leicester, H. Weir, M. Meaux, S. Grebas, C.Solomon, M. Holland, T. Northcutt, R. A. Restrepo, R. Bilodeau, 2013. NASA/Global Change Master Directory (GCMD) Earth Science Keywords. Version 8.0.0.0.0


