Earth
ID: 391
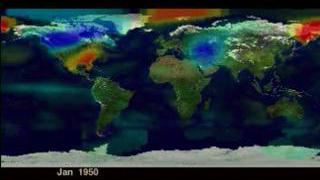
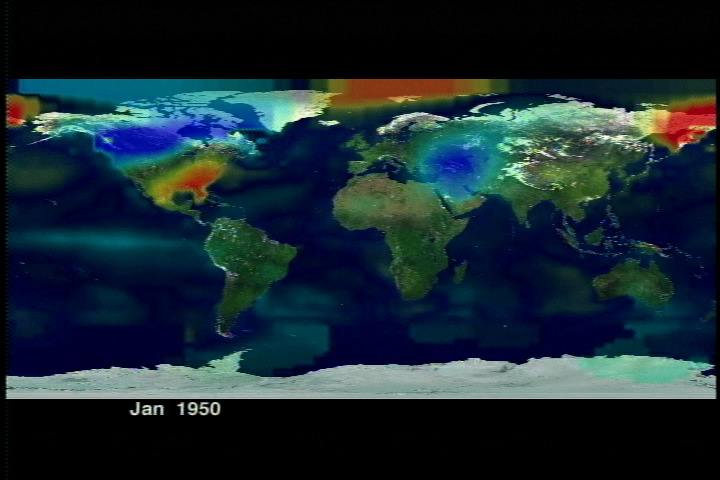
Global surface temperatures in 1998 set a new record for the period of instrumental measurements, report researchers at the NASA Goddard Institute for Space Studies who analyze data collected from several thousand meteorological stations around the world. This visualization shows surface temperature anomalies from 1950 through November, 1998. The 1998 warmth was associated partly with a strong El Niño that warmed the air over the eastern tropical Pacific Ocean in the first half of the year and in turn affected weather around the world. Red and yellow colors indicate warmer than normal conditions and blue colors indicates cooler than normal conditions.
Seasonal Global Surface Temperature Anomaly: January 1950 through October 1998 (Slow)
Alternate Version
Visualization Credits
Please give credit for this item to:
NASA/Goddard Space Flight Center Scientific Visualization Studio
NASA/Goddard Space Flight Center Scientific Visualization Studio
Short URL to share this page:
https://svs.gsfc.nasa.gov/391
Data Used:
Note: While we identify the data sets used in these visualizations, we do not store any further details nor the data sets themselves on our site.
This item is part of this series:
Global Temperature Anomalies
Goddard TV Tape:
G1998-063
Keywords:
DLESE >> Atmospheric science
DLESE >> Climatology
SVS >> Temperature
NASA Science >> Earth
https://svs.gsfc.nasa.gov/391
Data Used:
Seasonal Global Surface Temperature Anomalies also referred to as: Surface Temperature Anomalies
1950/01-1998/10
Meterological stations, ship, and satellite measurements of sea surface temperature
This item is part of this series:
Global Temperature Anomalies
Goddard TV Tape:
G1998-063
Keywords:
DLESE >> Atmospheric science
DLESE >> Climatology
SVS >> Temperature
NASA Science >> Earth


