Earth
ID: 3885
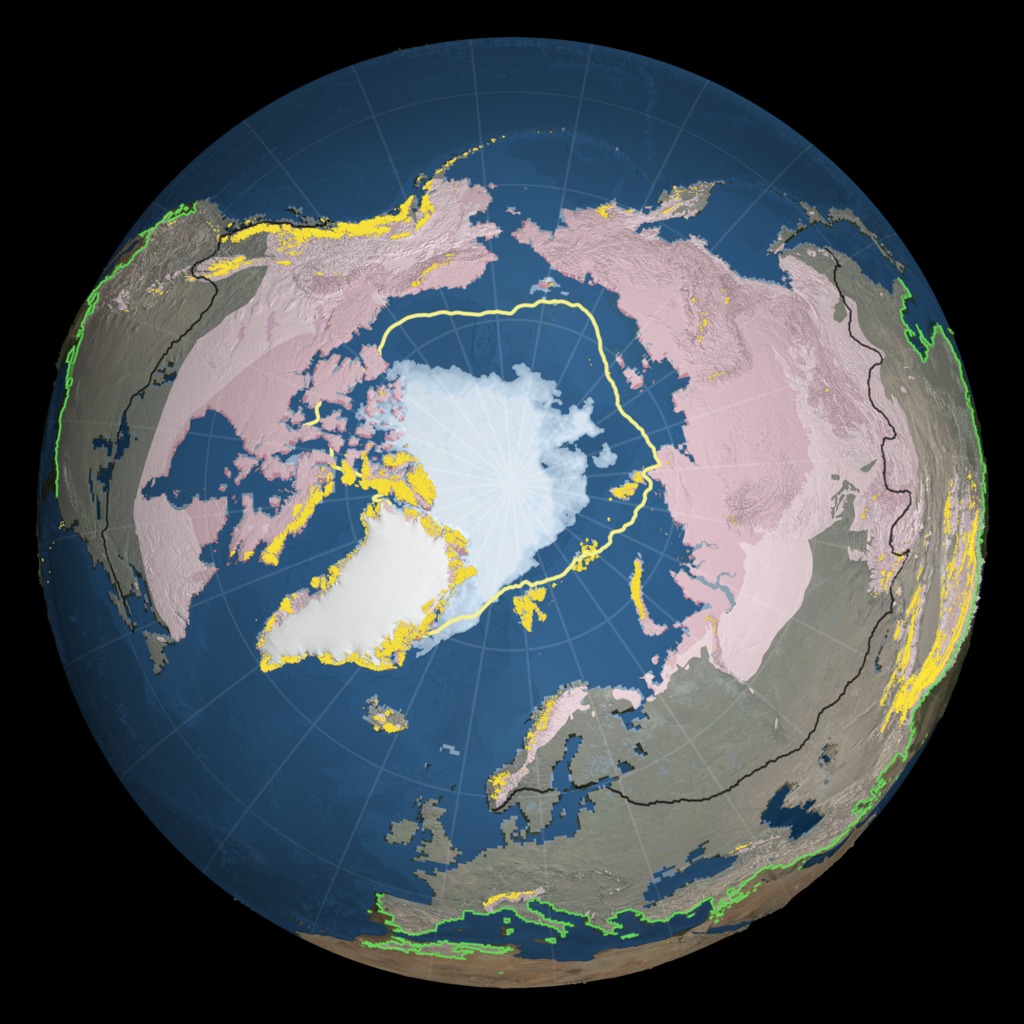
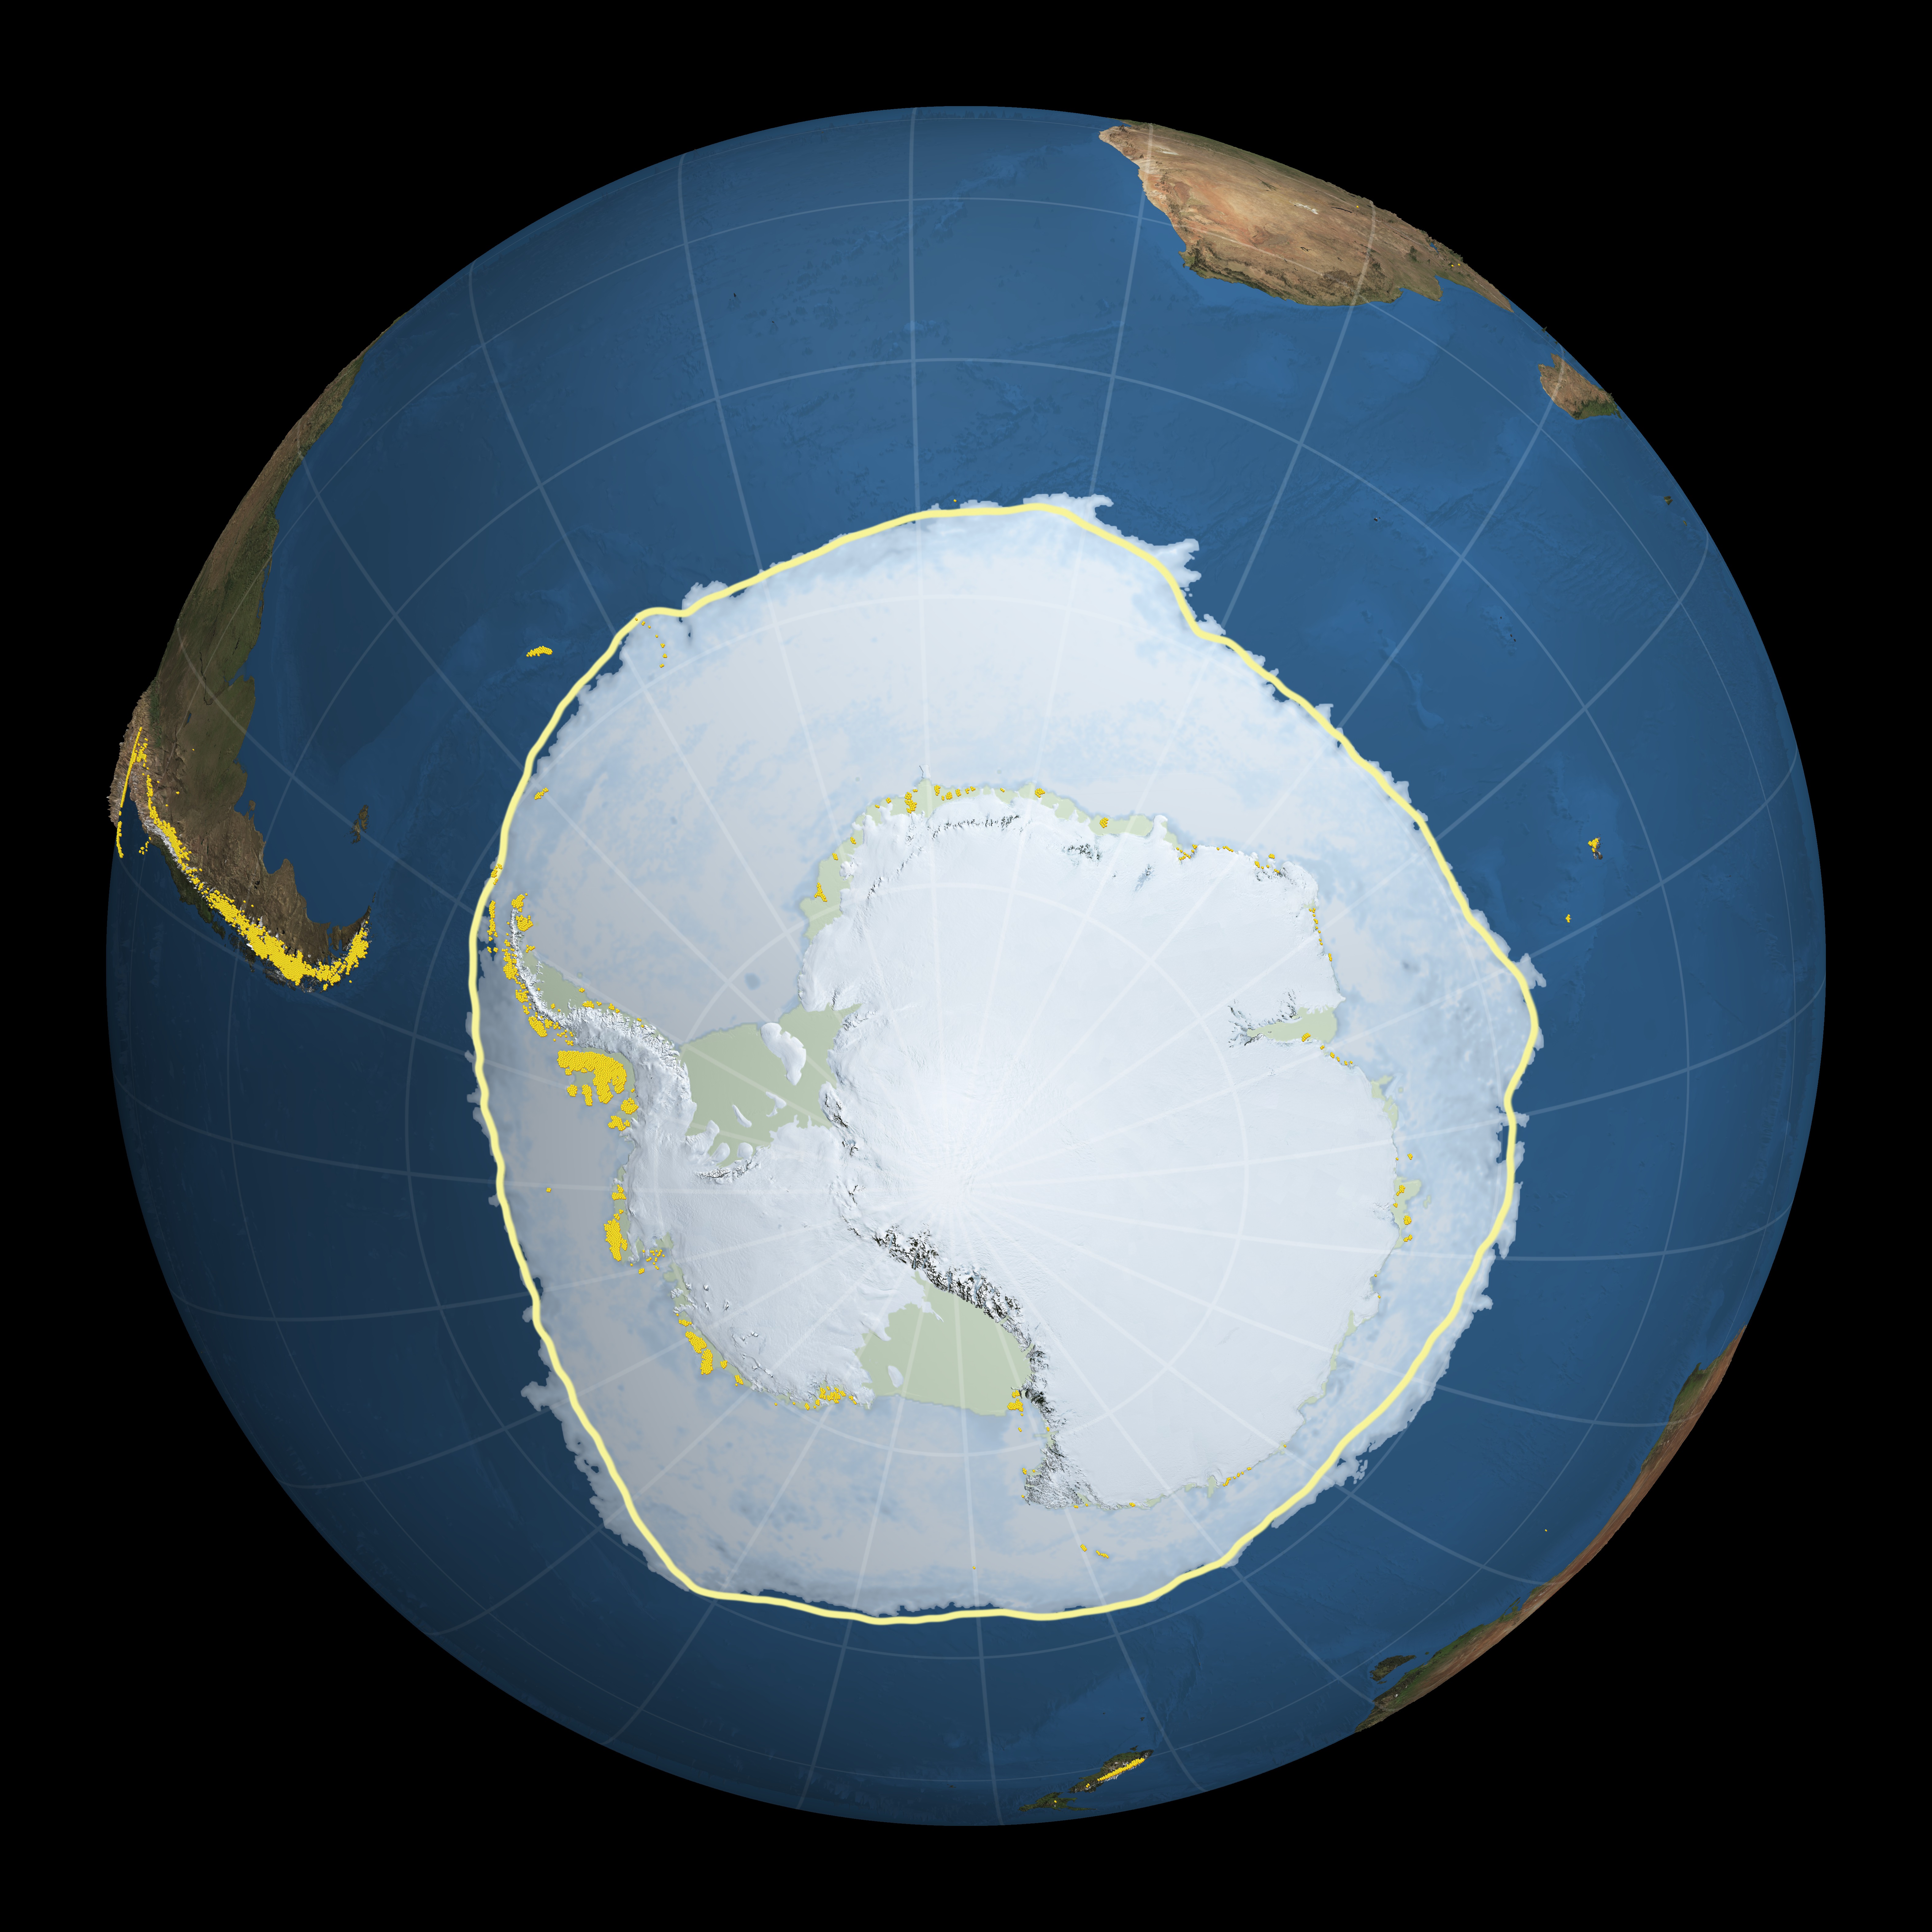
This high resolution image, designed for the Fifth Assessment Report of the Intergovernmental Panel on Climate Change, shows the extent of the regions affected by components of the cryosphere around the world. Over land, continuous permafrost is shown in a dark pink while discontinuous permafrost is shown in a lighter shade of pink. Over much of the northern hemisphere's land area, a semi-transparent white veil depicts the regions that are affected by snowfall at least one day during the perion 2000-2012. The bright green line along the southern border of this region shows the maximum snow extent while a black line across the North America, Europe and Asia shows the 50% snow extent line. Glaciers are shown as small golden dots in mountainous areas and in the far northern and southern latitudes. Over the water, ice shelves are shown around Antarctica along with sea ice surrounding the ice shelves. Sea ice is also shown at the North Pole, where the 30 year average sea ice extent is shown by a yellow outline. In addition, the ice sheets of Greenland and Antarctica are clearly visible.


Components of the Cryosphere
Related Documentation
Visualization Credits
Cindy Starr (Global Science and Technology, Inc.): Lead Visualizer
Josefino Comiso (NASA/GSFC): Scientist
Tinjun Zhang (NSIDC Cooperative Institute for Research in Environmental Sciences): Scientist
James W. Williams (GST): Project Support
Laurence Schuler (ADNET Systems, Inc.): Project Support
Ian Jones (ADNET Systems, Inc.): Project Support
Josefino Comiso (NASA/GSFC): Scientist
Tinjun Zhang (NSIDC Cooperative Institute for Research in Environmental Sciences): Scientist
James W. Williams (GST): Project Support
Laurence Schuler (ADNET Systems, Inc.): Project Support
Ian Jones (ADNET Systems, Inc.): Project Support
Please give credit for this item to:
NASA/Goddard Space Flight Center Scientific Visualization Studio
NASA/Goddard Space Flight Center Scientific Visualization Studio
Short URL to share this page:
https://svs.gsfc.nasa.gov/3885
Data Used:
Note: While we identify the data sets used in these visualizations, we do not store any further details nor the data sets themselves on our site.
Keywords:
DLESE >> Cryology
SVS >> Ice Shelf
GCMD >> Earth Science >> Cryosphere
GCMD >> Earth Science >> Cryosphere >> Glaciers/Ice Sheets
GCMD >> Earth Science >> Cryosphere >> Sea Ice
GCMD >> Earth Science >> Cryosphere >> Snow/Ice
GCMD >> Earth Science >> Hydrosphere >> Glaciers/Ice Sheets
GCMD >> Earth Science >> Hydrosphere >> Snow/Ice
GCMD >> Earth Science >> Oceans >> Sea Ice
GCMD >> Earth Science >> Atmosphere >> Precipitation >> Snow
GCMD >> Earth Science >> Cryosphere >> Frozen Ground >> Permafrost
GCMD >> Earth Science >> Cryosphere >> Glaciers/Ice Sheets >> Glaciers
GCMD >> Earth Science >> Cryosphere >> Sea Ice >> Ice Extent
GCMD >> Earth Science >> Cryosphere >> Sea Ice >> Ice Types
GCMD >> Earth Science >> Cryosphere >> Sea Ice >> Sea Ice Concentration
GCMD >> Earth Science >> Cryosphere >> Snow/Ice >> Ice Extent
GCMD >> Earth Science >> Cryosphere >> Snow/Ice >> Permafrost
GCMD >> Earth Science >> Cryosphere >> Snow/Ice >> Snow Cover
GCMD >> Earth Science >> Hydrosphere >> Snow/Ice >> Ice Extent
GCMD >> Earth Science >> Hydrosphere >> Snow/Ice >> Permafrost
GCMD >> Earth Science >> Hydrosphere >> Snow/Ice >> Snow Cover
GCMD >> Earth Science >> Land Surface >> Frozen Ground >> Permafrost
GCMD >> Earth Science >> Oceans >> Sea Ice >> Ice Extent
NASA Science >> Earth
GCMD keywords can be found on the Internet with the following citation: Olsen, L.M., G. Major, K. Shein, J. Scialdone, S. Ritz, T. Stevens, M. Morahan, A. Aleman, R. Vogel, S. Leicester, H. Weir, M. Meaux, S. Grebas, C.Solomon, M. Holland, T. Northcutt, R. A. Restrepo, R. Bilodeau, 2013. NASA/Global Change Master Directory (GCMD) Earth Science Keywords. Version 8.0.0.0.0
https://svs.gsfc.nasa.gov/3885
Data Used:
Aqua/AMSR-E/Daily L3 6.25 km 89 GHz Brightness Temperature (Tb)
Aqua/AMSR-E/Daily L3 12.5km Tb, Sea Ice Concentration, and Snow Depth also referred to as: Sea Ice Concentration
Circum-Arctic Map of Permafrost and Ground-Ice Conditions
Data Compilation - NSIDCInteractive Multisensor Snow and Ice Mapping System (IMS)/IMS Daily Northern Hemisphere Snow and Ice Analysis - 24 km Resolution also referred to as: IMS Daily Northern Hemisphere Snow and Ice Analysis
Analysis - NOAAKeywords:
DLESE >> Cryology
SVS >> Ice Shelf
GCMD >> Earth Science >> Cryosphere
GCMD >> Earth Science >> Cryosphere >> Glaciers/Ice Sheets
GCMD >> Earth Science >> Cryosphere >> Sea Ice
GCMD >> Earth Science >> Cryosphere >> Snow/Ice
GCMD >> Earth Science >> Hydrosphere >> Glaciers/Ice Sheets
GCMD >> Earth Science >> Hydrosphere >> Snow/Ice
GCMD >> Earth Science >> Oceans >> Sea Ice
GCMD >> Earth Science >> Atmosphere >> Precipitation >> Snow
GCMD >> Earth Science >> Cryosphere >> Frozen Ground >> Permafrost
GCMD >> Earth Science >> Cryosphere >> Glaciers/Ice Sheets >> Glaciers
GCMD >> Earth Science >> Cryosphere >> Sea Ice >> Ice Extent
GCMD >> Earth Science >> Cryosphere >> Sea Ice >> Ice Types
GCMD >> Earth Science >> Cryosphere >> Sea Ice >> Sea Ice Concentration
GCMD >> Earth Science >> Cryosphere >> Snow/Ice >> Ice Extent
GCMD >> Earth Science >> Cryosphere >> Snow/Ice >> Permafrost
GCMD >> Earth Science >> Cryosphere >> Snow/Ice >> Snow Cover
GCMD >> Earth Science >> Hydrosphere >> Snow/Ice >> Ice Extent
GCMD >> Earth Science >> Hydrosphere >> Snow/Ice >> Permafrost
GCMD >> Earth Science >> Hydrosphere >> Snow/Ice >> Snow Cover
GCMD >> Earth Science >> Land Surface >> Frozen Ground >> Permafrost
GCMD >> Earth Science >> Oceans >> Sea Ice >> Ice Extent
NASA Science >> Earth
GCMD keywords can be found on the Internet with the following citation: Olsen, L.M., G. Major, K. Shein, J. Scialdone, S. Ritz, T. Stevens, M. Morahan, A. Aleman, R. Vogel, S. Leicester, H. Weir, M. Meaux, S. Grebas, C.Solomon, M. Holland, T. Northcutt, R. A. Restrepo, R. Bilodeau, 2013. NASA/Global Change Master Directory (GCMD) Earth Science Keywords. Version 8.0.0.0.0


