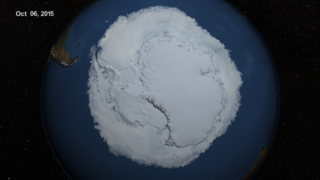
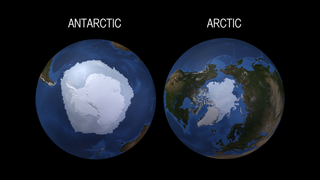
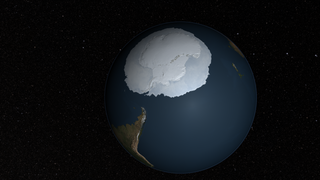
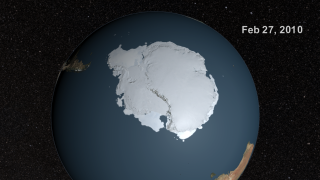
AMSR-E Antarctic Sea Ice
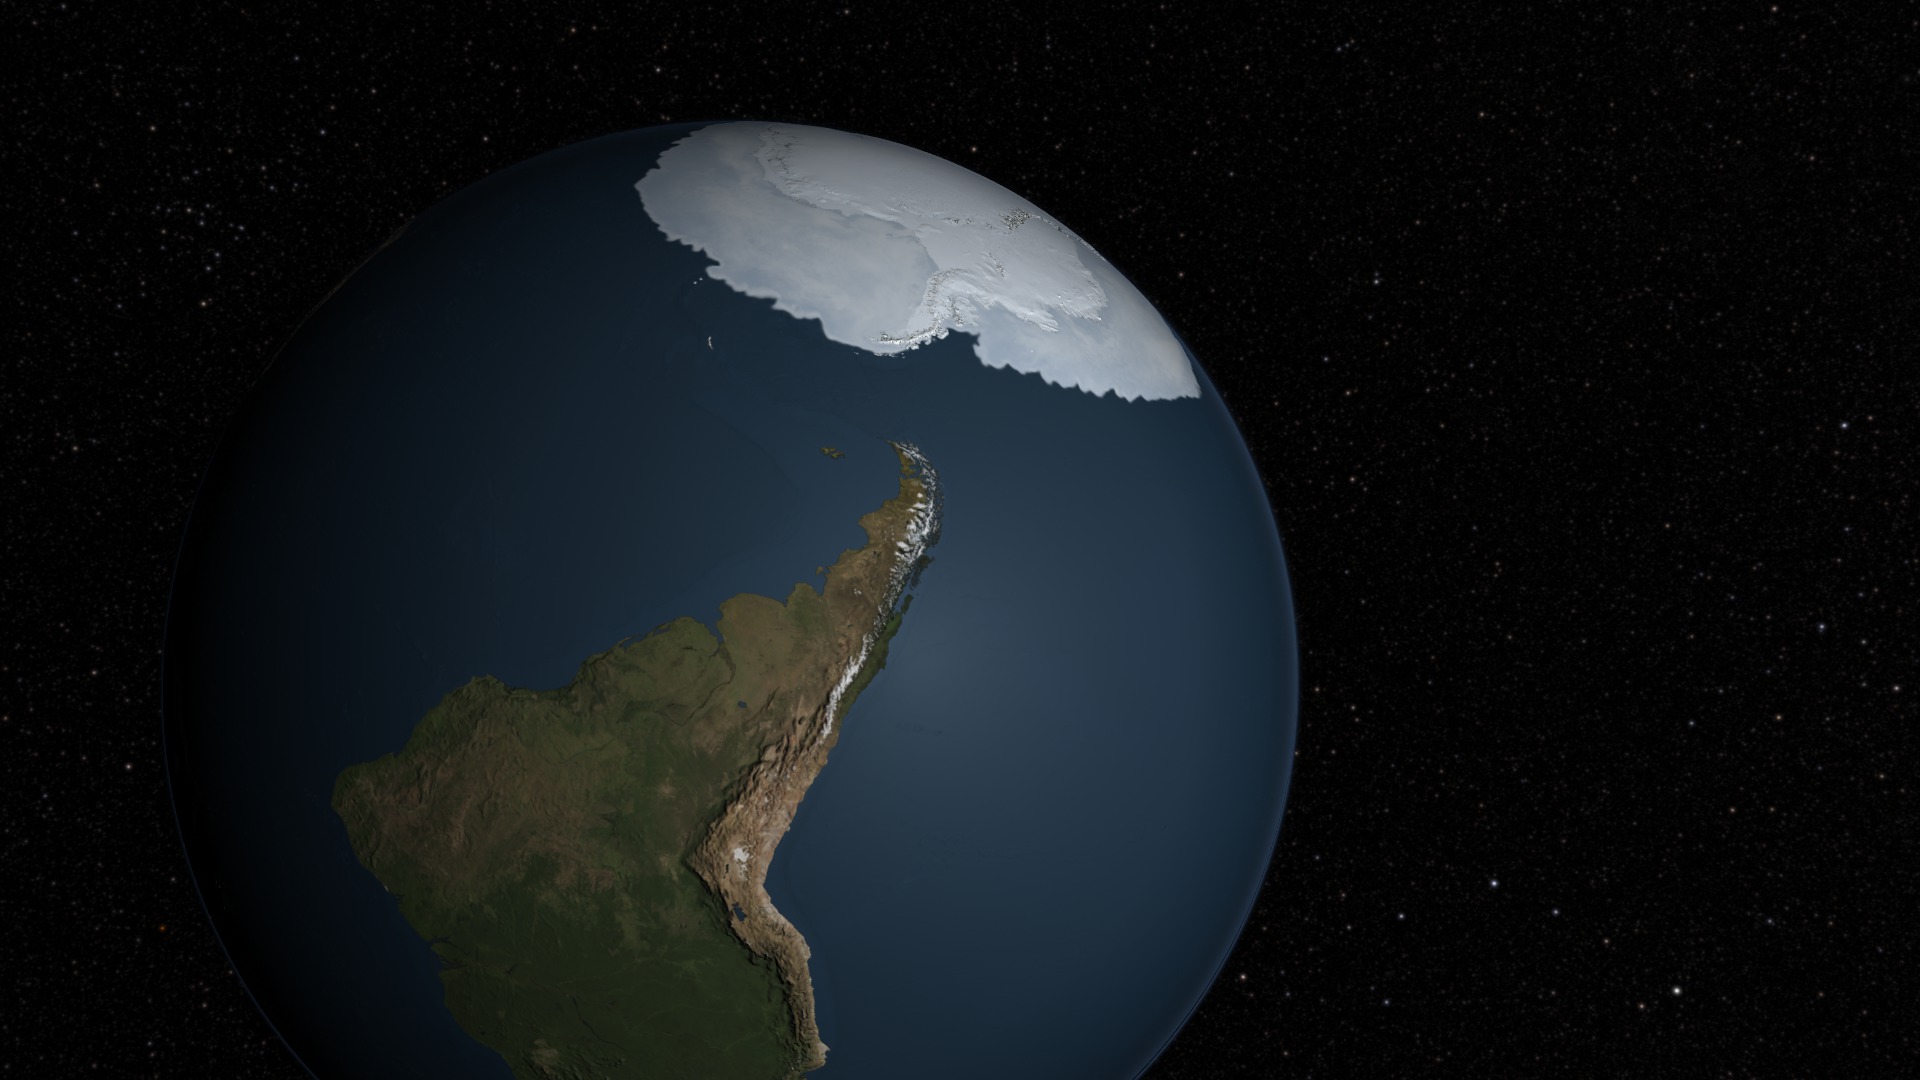
In this animation, the Antarctic sea ice progresses through time from May 26, 2009 through July 31, 2010. Over the water, Arctic sea ice changes from day to day showing a running 3-day average sea ice concentration in the region where the concentration is greater than 15%. The blueish white color of the sea ice is derived from a 3-day running minimum of the AMSR-E 89 GHz brightness temperature. Over the Antarctic continent, the LIMA data shown here uses the pan-chromatic band and has a resolution of 240 meters per pixel. The Landsat Image Mosaic of Antarctica (LIMA) is a data product funded by the National Science Foundation (NSF) and jointly produced by the U.S. Geological Survey (USGS), the British Antarctic Survey (BAS), and the National Aeronautics and Space Administration (NASA).
Related
Visualization Credits
Trent L. Schindler (UMBC): Animator
Ryan Fitzgibbons (USRA): Producer
Duncan Copp (Houston Symphony): Producer
Josefino Comiso (NASA/GSFC): Scientist
James W. Williams (GST): Project Support
Shiloh Heurich (GST): Project Support
https://svs.gsfc.nasa.gov/3854
Missions:
Landsat
Terra
Data Used:
Landsat-7/ETM+/Landsat Image Mosaic of Antarctica also referred to as: LIMA
Mosaic - NASA/GSFC, British Antarctic Survey, USGS EROS Data CenterTerra and Aqua/MODIS/Blue Marble Land Cover
2004/01/01 to 2004/12/31The Blue Marble data is courtesy of Reto Stockli (NASA/GSFC).
Aqua/AMSR-E/Daily L3 12.5km Tb, Sea Ice Concentration, and Snow Depth also referred to as: Sea Ice Concentration
2009/05/26 to 2010/07/31Aqua/AMSR-E/Daily L3 6.25 km 89 GHz Brightness Temperature (Tb)
2009/05/26 to 2010/07/31Keywords:
DLESE >> Cryology
SVS >> HDTV
DLESE >> Physical oceanography
GCMD >> Earth Science >> Cryosphere
GCMD >> Earth Science >> Cryosphere >> Sea Ice
GCMD >> Earth Science >> Cryosphere >> Snow/Ice
GCMD >> Earth Science >> Hydrosphere >> Snow/Ice
GCMD >> Earth Science >> Oceans >> Sea Ice
GCMD >> Earth Science >> Cryosphere >> Sea Ice >> Ice Extent
GCMD >> Earth Science >> Cryosphere >> Sea Ice >> Ice Floes
GCMD >> Earth Science >> Cryosphere >> Sea Ice >> Ice Growth/Melt
GCMD >> Earth Science >> Cryosphere >> Sea Ice >> Ice Types
GCMD >> Earth Science >> Cryosphere >> Sea Ice >> Pack Ice
GCMD >> Earth Science >> Cryosphere >> Sea Ice >> Sea Ice Concentration
GCMD >> Earth Science >> Cryosphere >> Sea Ice >> Sea Ice Motion
GCMD >> Earth Science >> Cryosphere >> Snow/Ice >> Freeze/Thaw
GCMD >> Earth Science >> Cryosphere >> Snow/Ice >> Ice Extent
GCMD >> Earth Science >> Cryosphere >> Snow/Ice >> Ice Growth/Melt
GCMD >> Earth Science >> Cryosphere >> Snow/Ice >> Ice Motion
GCMD >> Earth Science >> Cryosphere >> Snow/Ice >> Lake Ice
GCMD >> Earth Science >> Hydrosphere >> Snow/Ice >> Ice Extent
GCMD >> Earth Science >> Hydrosphere >> Snow/Ice >> Ice Motion
GCMD >> Earth Science >> Hydrosphere >> Snow/Ice >> Lake Ice
GCMD >> Earth Science >> Oceans >> Sea Ice >> Ice Extent
GCMD >> Earth Science >> Oceans >> Sea Ice >> Ice Growth/Melt
GCMD >> Earth Science >> Oceans >> Sea Ice >> Pack Ice
SVS >> Hyperwall
NASA Science >> Earth
GCMD keywords can be found on the Internet with the following citation: Olsen, L.M., G. Major, K. Shein, J. Scialdone, S. Ritz, T. Stevens, M. Morahan, A. Aleman, R. Vogel, S. Leicester, H. Weir, M. Meaux, S. Grebas, C.Solomon, M. Holland, T. Northcutt, R. A. Restrepo, R. Bilodeau, 2013. NASA/Global Change Master Directory (GCMD) Earth Science Keywords. Version 8.0.0.0.0


