Earth
ID: 3825
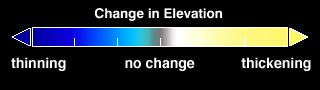
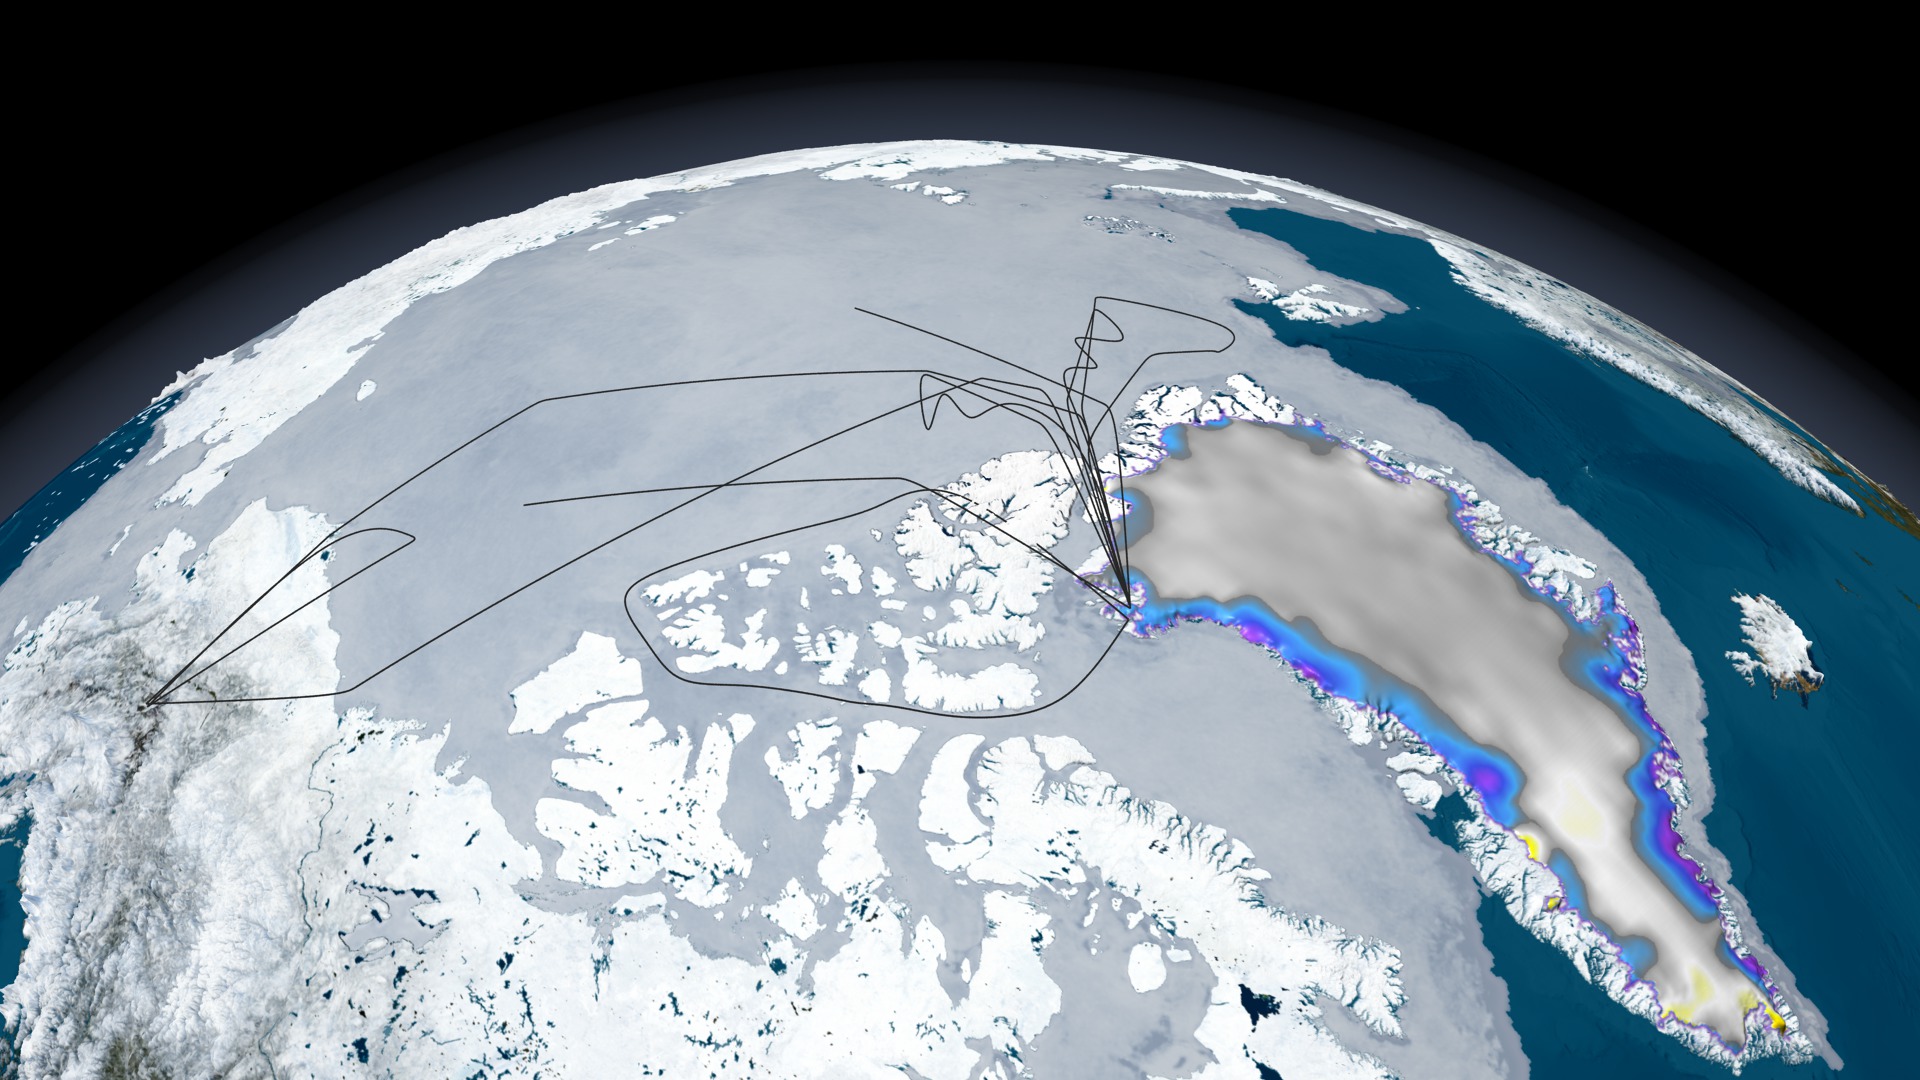
With the aircraft resources of NASA's Airborne Sciences Program, Operation IceBridge is taking to the sky to ensure a sustained, critical watch over Earth's polar regions. Flight lines (black) are shown for the 2011 campaign over Arctic sea ice and Greenland's land ice. Many flights target outlet glaciers along the coast where NASA's Ice, Cloud and land Elevation Satellite (ICESat) shows significant thinning. Blue and purple colors, respectively, indicate moderate to large thinning. Gray and yellow, respectively, indicate slight to moderate thickening. Since its launch in January 2003, the ICESat elevation satellite has been measuring the change in thickness of ice sheets. This image of Greenland shows the changes in elevation over the Greenland ice sheet between 2003 and 2006.


Operation IceBridge 2011 Arctic Flight Paths and Change in Elevation Data over Greenland
Visualization Credits
Lori Perkins (NASA/GSFC): Lead Animator
Cindy Starr (Global Science and Technology, Inc.): Visualizer
Jefferson Beck (UMBC): Producer
Jay Zwally (NASA/GSFC): Scientist
Thorsten Markus (NASA/GSFC): Scientist
Lora Koenig (NASA/GSFC): Scientist
John Sonntag (EGG): Project Support
Kathryn Hansen (Wyle Information Systems): Writer
Cindy Starr (Global Science and Technology, Inc.): Visualizer
Jefferson Beck (UMBC): Producer
Jay Zwally (NASA/GSFC): Scientist
Thorsten Markus (NASA/GSFC): Scientist
Lora Koenig (NASA/GSFC): Scientist
John Sonntag (EGG): Project Support
Kathryn Hansen (Wyle Information Systems): Writer
Please give credit for this item to:
NASA/Goddard Space Flight Center Scientific Visualization Studio The Next Generation Blue Marble data is courtesy of Reto Stockli (NASA/GSFC).
NASA/Goddard Space Flight Center Scientific Visualization Studio The Next Generation Blue Marble data is courtesy of Reto Stockli (NASA/GSFC).
Short URL to share this page:
https://svs.gsfc.nasa.gov/3825
Missions:
Ice, Cloud, and land Elevation Satellite (ICESat)
Operation IceBridge
Data Used:
Note: While we identify the data sets used in these visualizations, we do not store any further details nor the data sets themselves on our site.
Keywords:
DLESE >> Cryology
SVS >> HDTV
GCMD >> Earth Science >> Cryosphere
GCMD >> Earth Science >> Cryosphere >> Snow/Ice
GCMD >> Earth Science >> Hydrosphere >> Snow/Ice
GCMD >> Earth Science >> Atmosphere >> Precipitation >> Snow
GCMD >> Earth Science >> Cryosphere >> Glaciers/Ice Sheets >> Glacier Elevation/Ice Sheet Elevation
GCMD >> Earth Science >> Cryosphere >> Glaciers/Ice Sheets >> Glacier Thickness/Ice Sheet Thickness
GCMD >> Earth Science >> Cryosphere >> Glaciers/Ice Sheets >> Ice Sheets
SVS >> Hyperwall
NASA Science >> Earth
GCMD keywords can be found on the Internet with the following citation: Olsen, L.M., G. Major, K. Shein, J. Scialdone, S. Ritz, T. Stevens, M. Morahan, A. Aleman, R. Vogel, S. Leicester, H. Weir, M. Meaux, S. Grebas, C.Solomon, M. Holland, T. Northcutt, R. A. Restrepo, R. Bilodeau, 2013. NASA/Global Change Master Directory (GCMD) Earth Science Keywords. Version 8.0.0.0.0
https://svs.gsfc.nasa.gov/3825
Missions:
Ice, Cloud, and land Elevation Satellite (ICESat)
Operation IceBridge
Data Used:
ICESat/GLAS
Aqua/AMSR-E/Daily L3 6.25 km 89 GHz Brightness Temperature (Tb)
Aqua/AMSR-E/Daily L3 12.5km Tb, Sea Ice Concentration, and Snow Depth also referred to as: Sea Ice Concentration
Operation Ice Bridge Flight Paths
March 2011
NASA DC-8 Flight Path
Keywords:
DLESE >> Cryology
SVS >> HDTV
GCMD >> Earth Science >> Cryosphere
GCMD >> Earth Science >> Cryosphere >> Snow/Ice
GCMD >> Earth Science >> Hydrosphere >> Snow/Ice
GCMD >> Earth Science >> Atmosphere >> Precipitation >> Snow
GCMD >> Earth Science >> Cryosphere >> Glaciers/Ice Sheets >> Glacier Elevation/Ice Sheet Elevation
GCMD >> Earth Science >> Cryosphere >> Glaciers/Ice Sheets >> Glacier Thickness/Ice Sheet Thickness
GCMD >> Earth Science >> Cryosphere >> Glaciers/Ice Sheets >> Ice Sheets
SVS >> Hyperwall
NASA Science >> Earth
GCMD keywords can be found on the Internet with the following citation: Olsen, L.M., G. Major, K. Shein, J. Scialdone, S. Ritz, T. Stevens, M. Morahan, A. Aleman, R. Vogel, S. Leicester, H. Weir, M. Meaux, S. Grebas, C.Solomon, M. Holland, T. Northcutt, R. A. Restrepo, R. Bilodeau, 2013. NASA/Global Change Master Directory (GCMD) Earth Science Keywords. Version 8.0.0.0.0


