Earth
ID: 3722
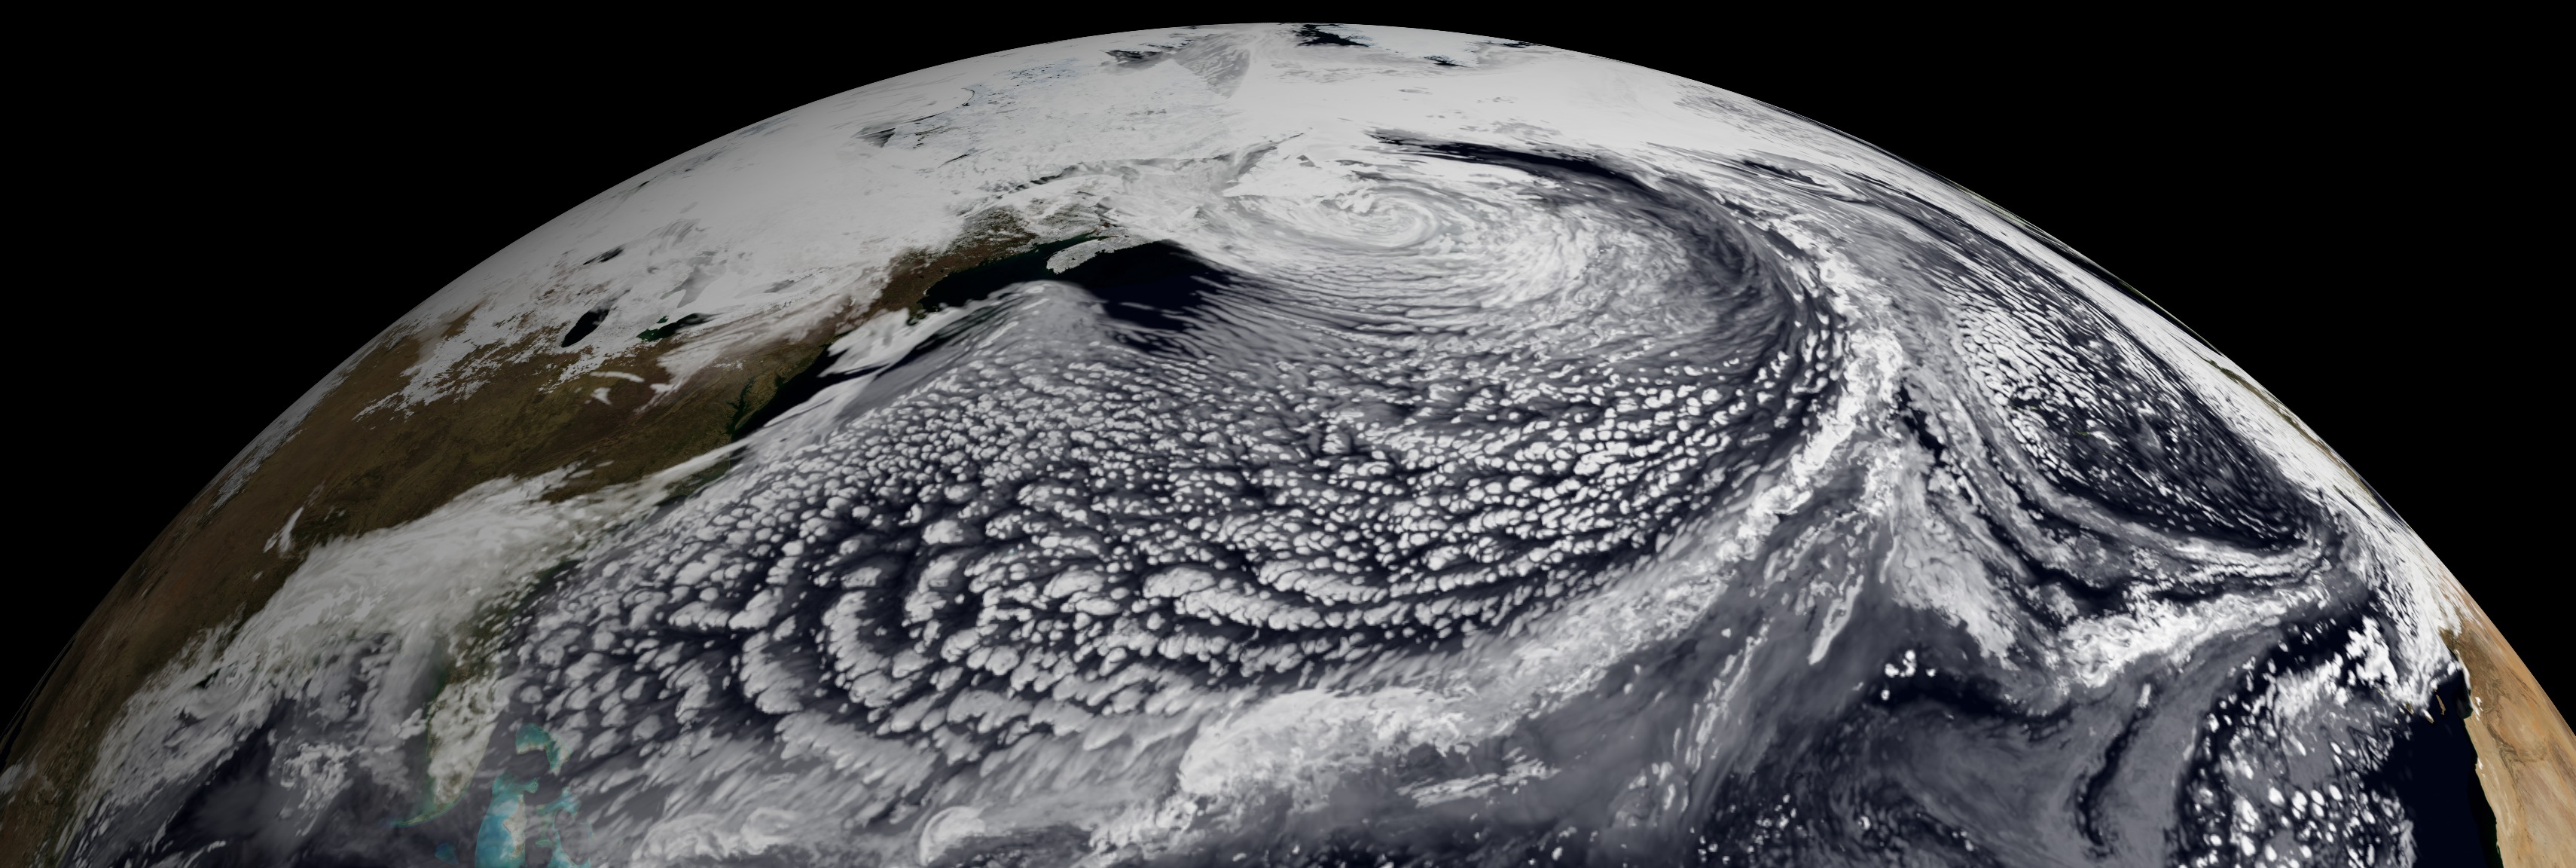
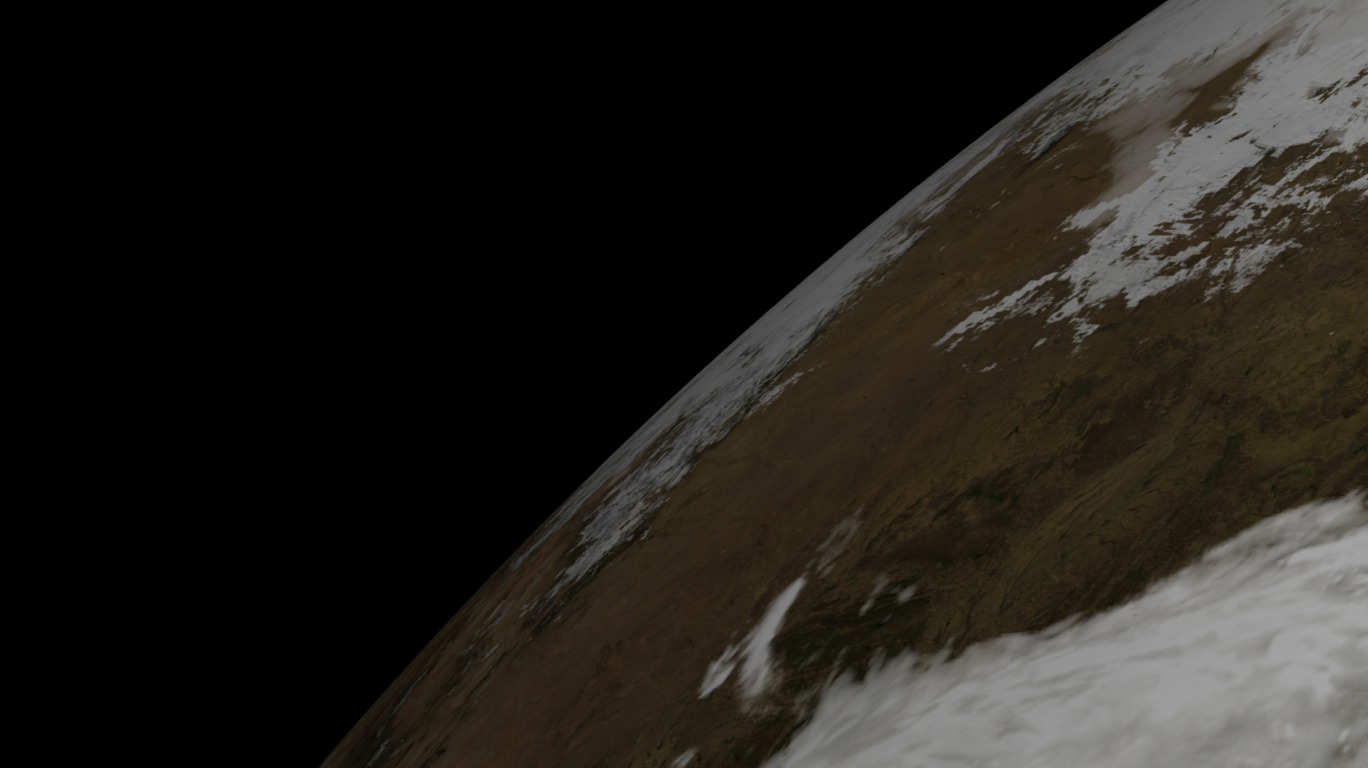
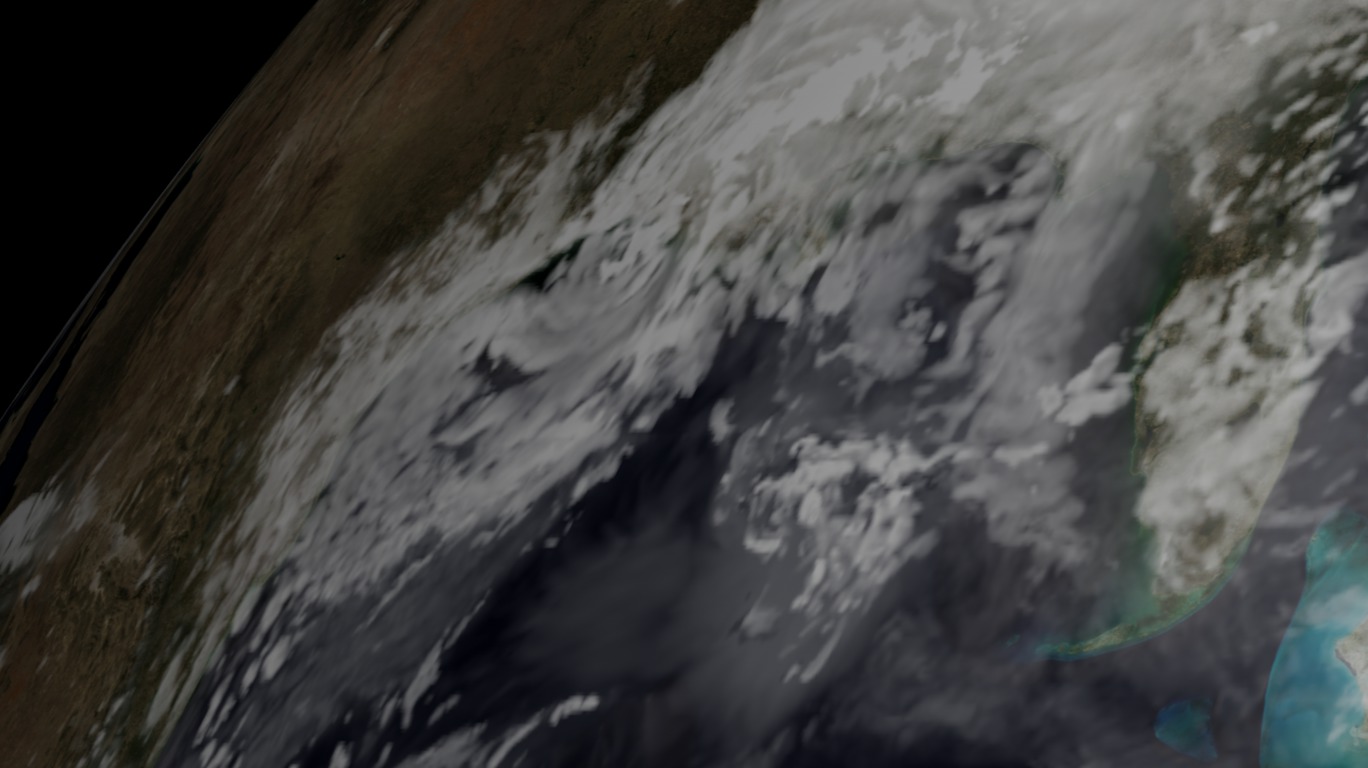
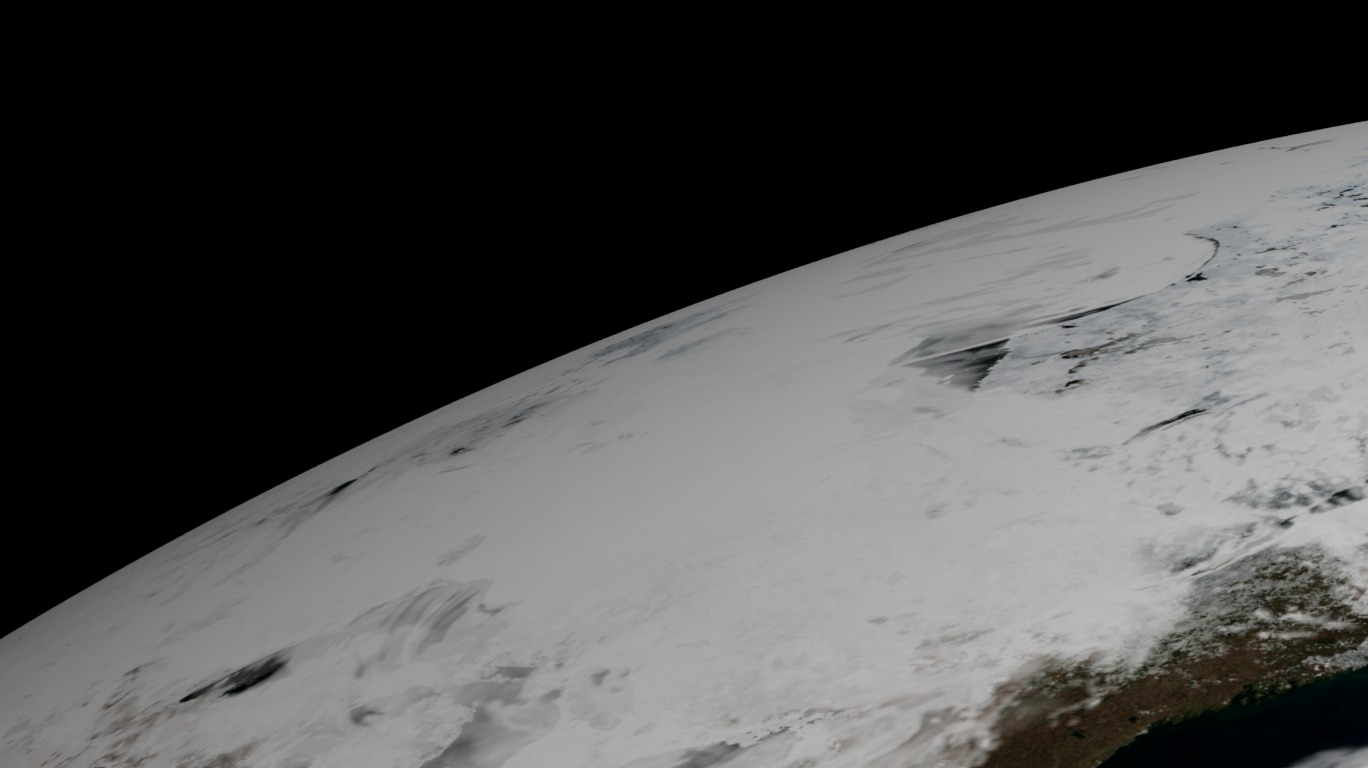
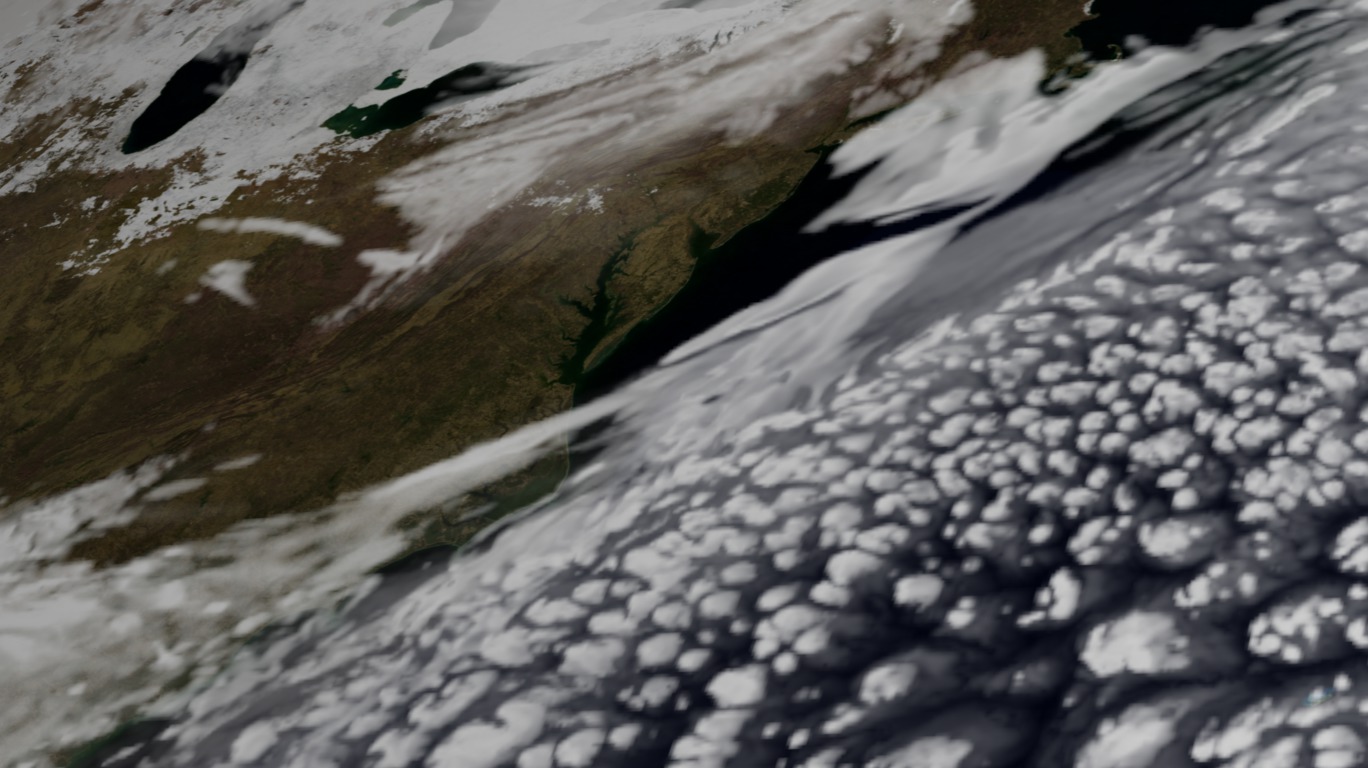
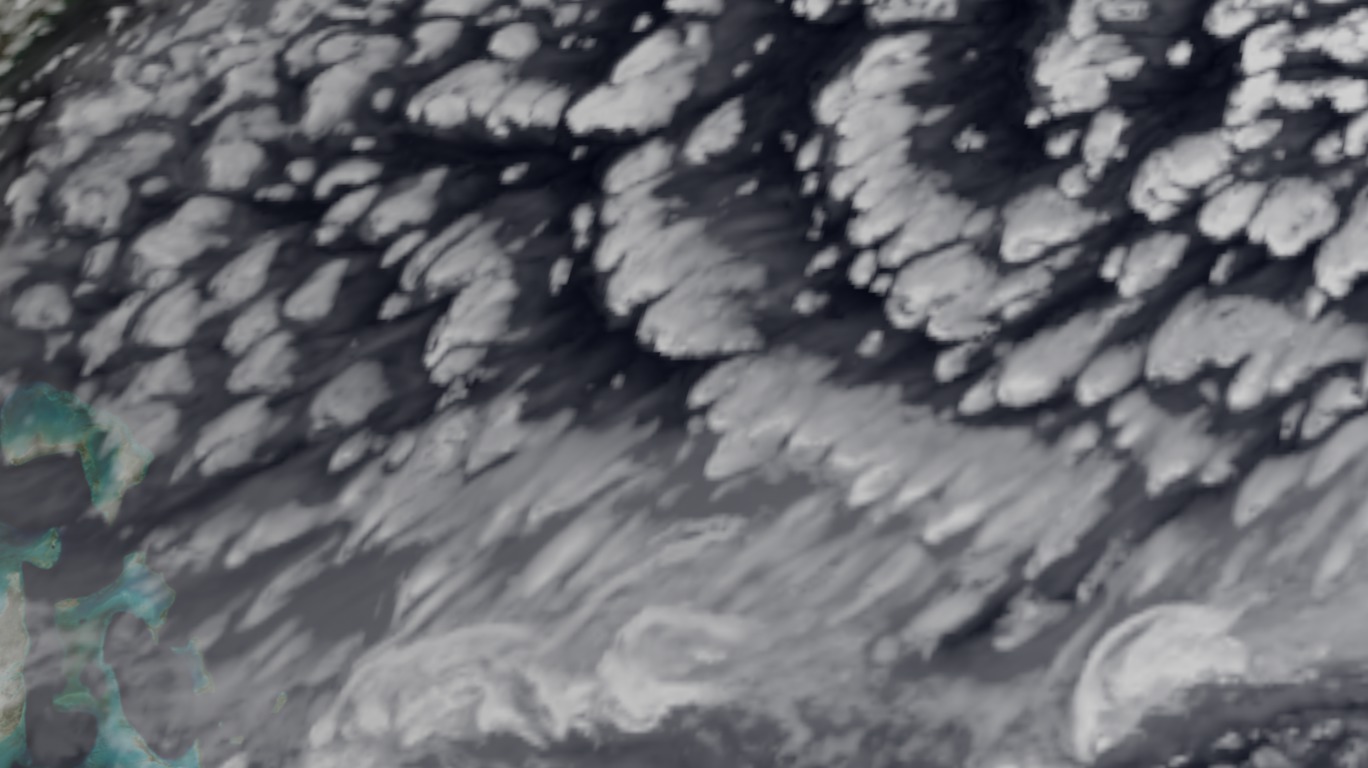
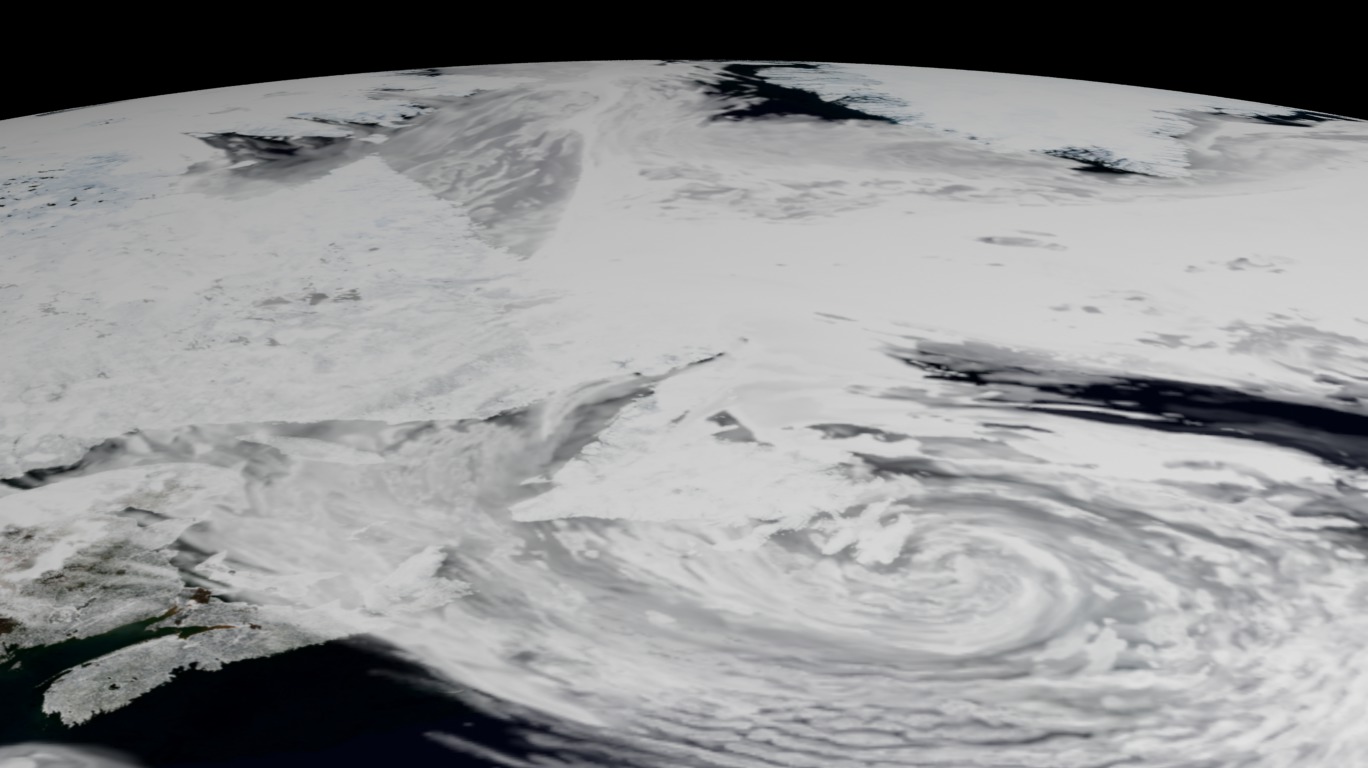
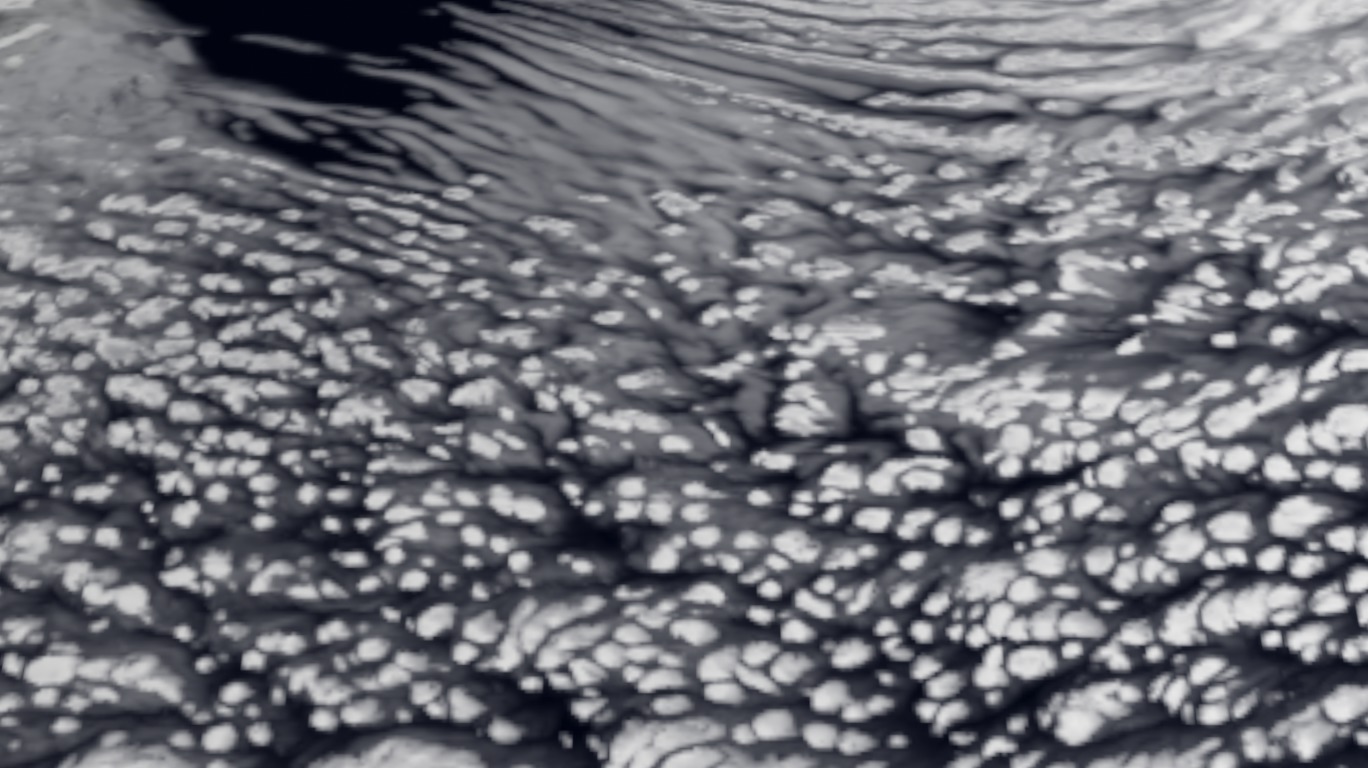
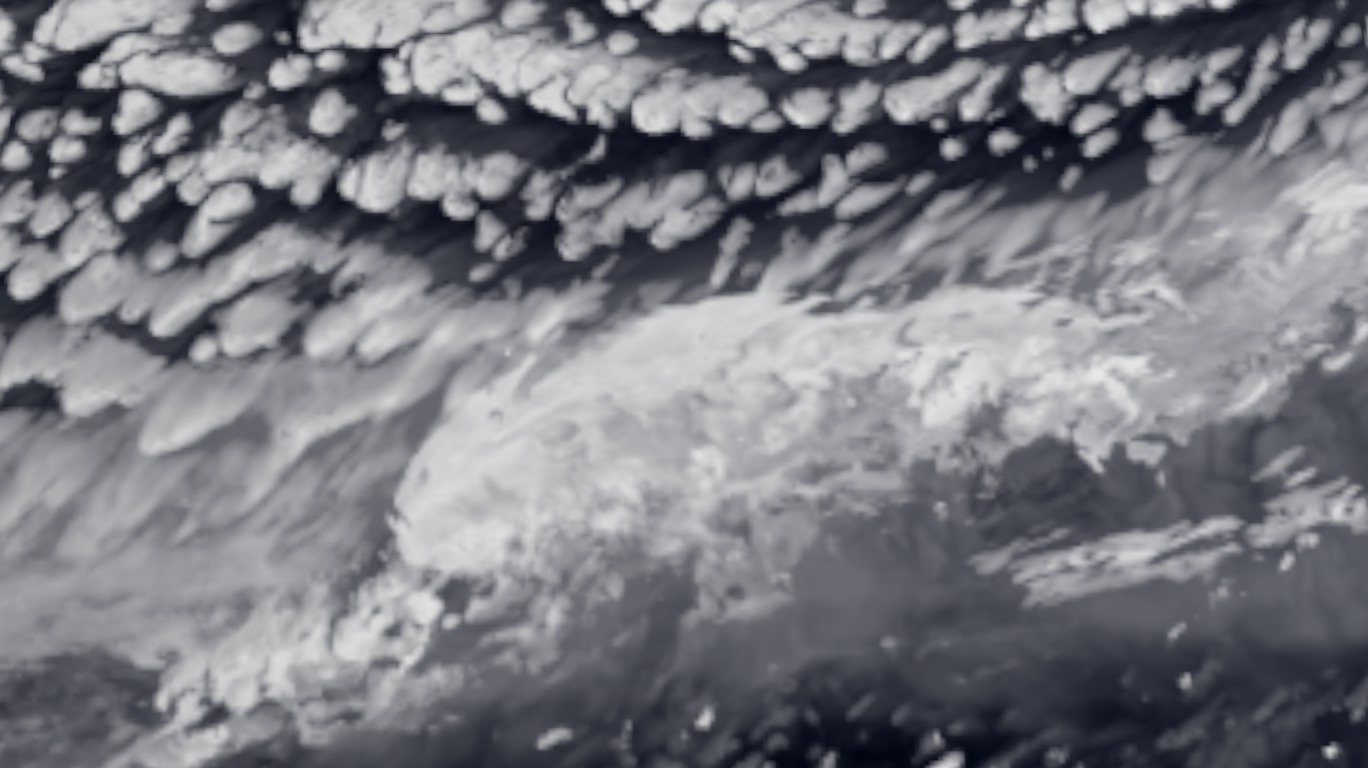
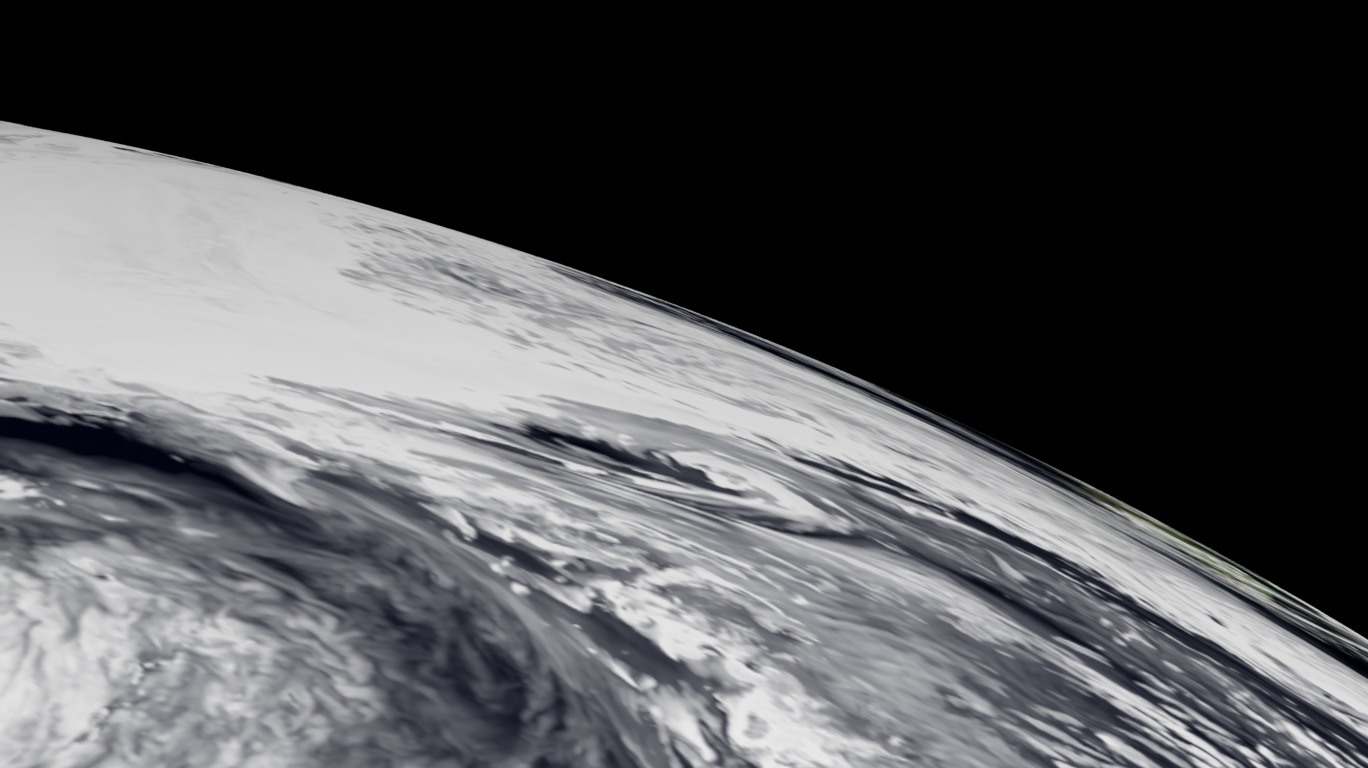
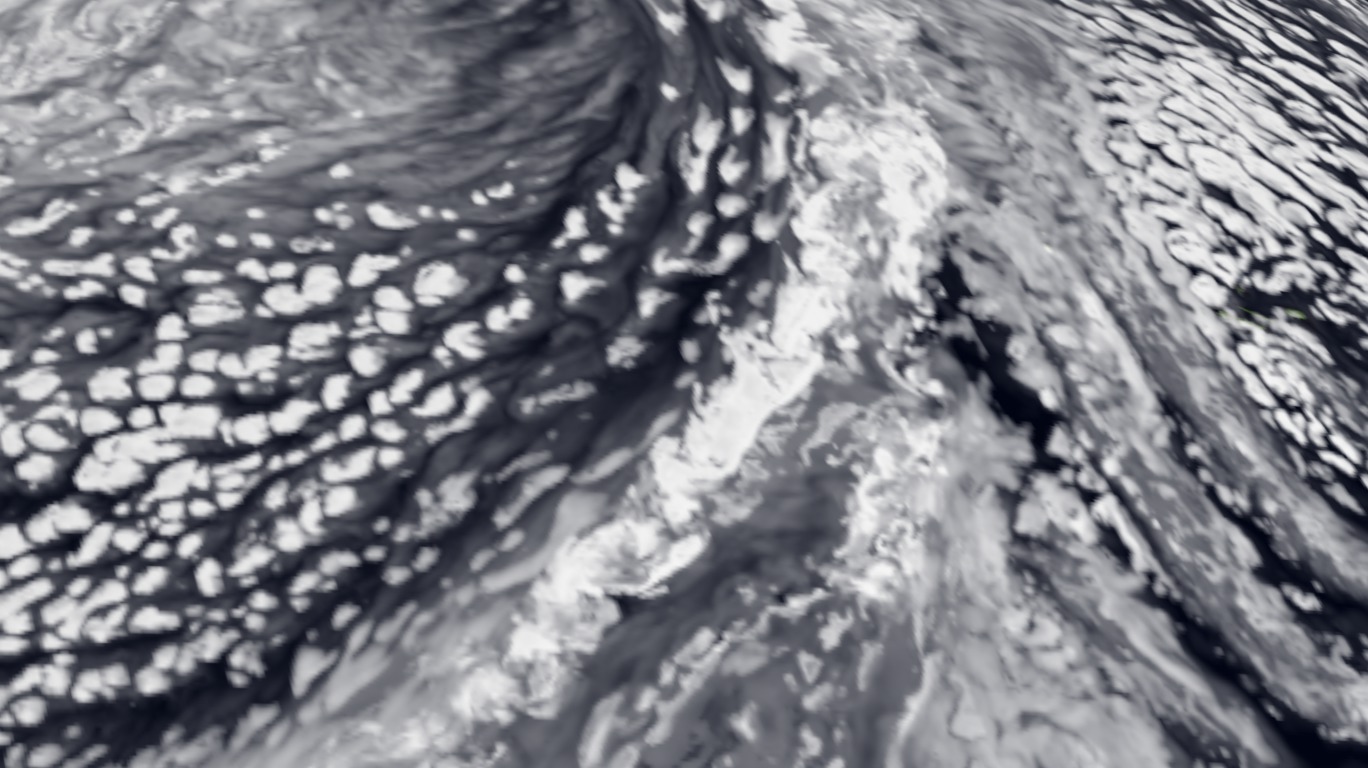
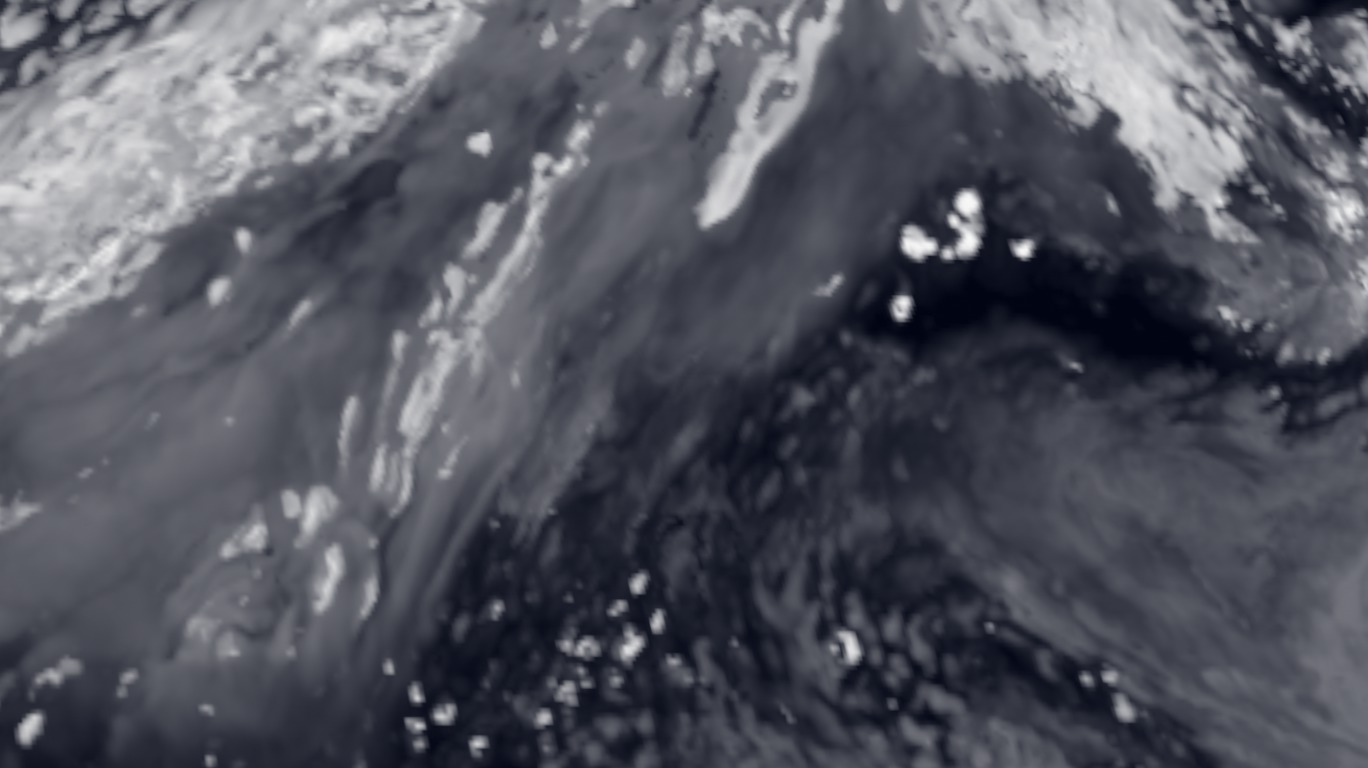
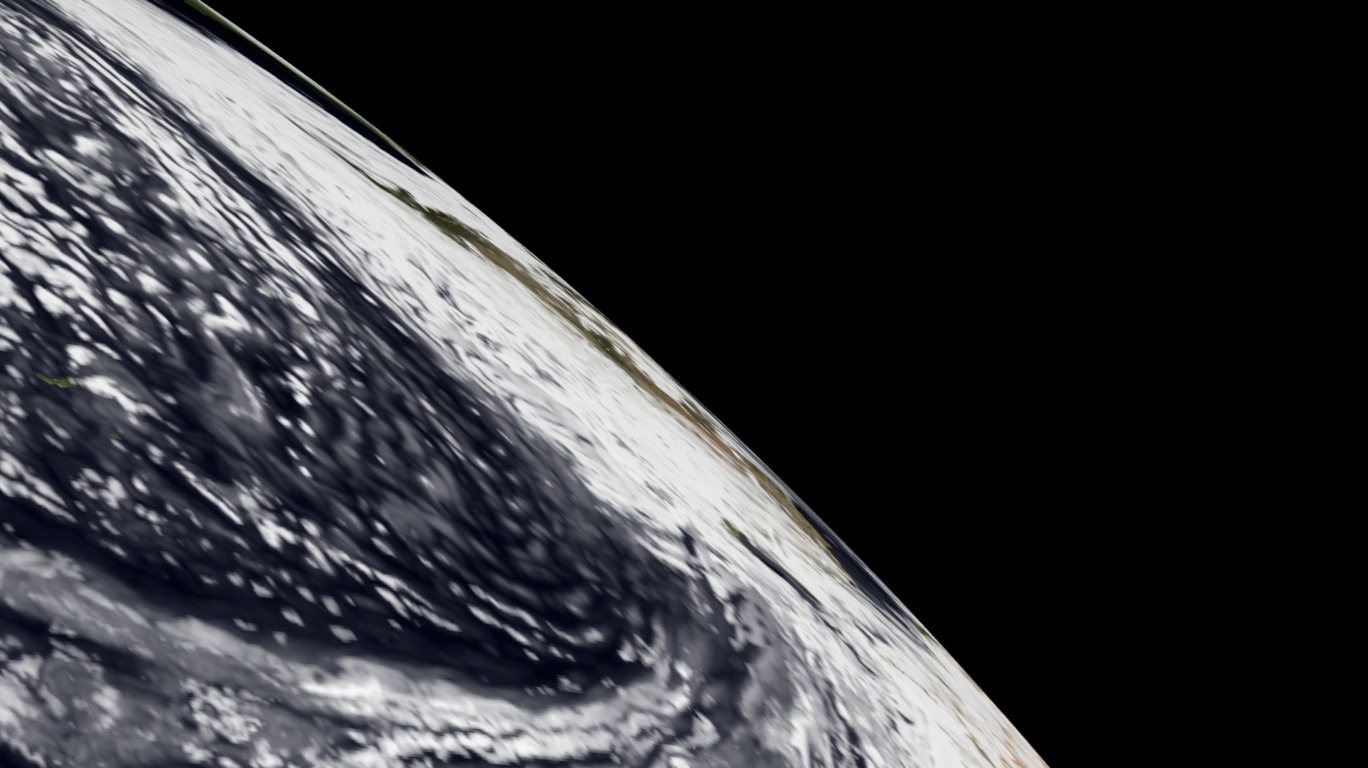
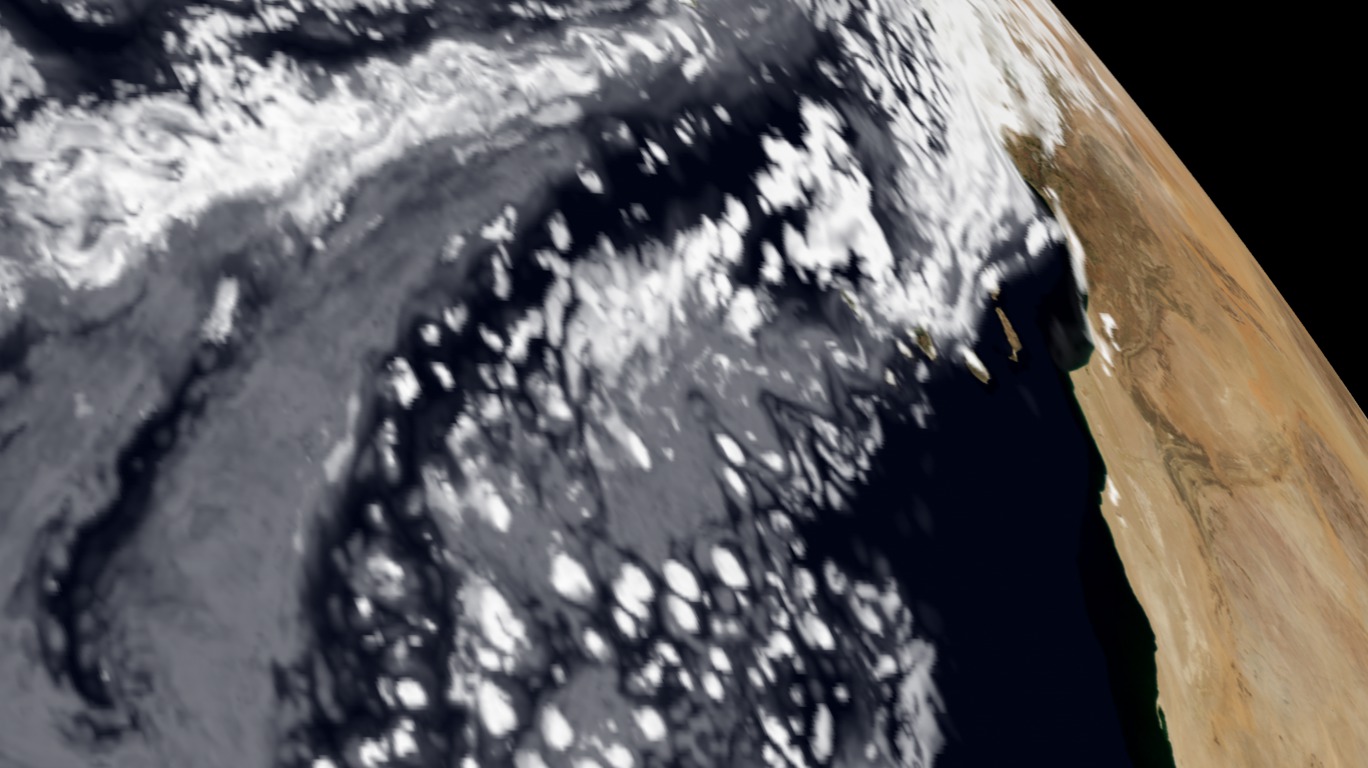
This visualization shows clouds from a simulation using the Goddard Earth Observing System Model, Verison 5 (GEOS-5). The global atmospheric simulation ran at 3.5 km per grid cell and covered a single day: January 2, 2009. The results of the simulation were written out at 10 minute intervals. Since there is only one day of simulation data, the sequence of clouds repeats several times. The white flash indicates the sequence is about to repeat.
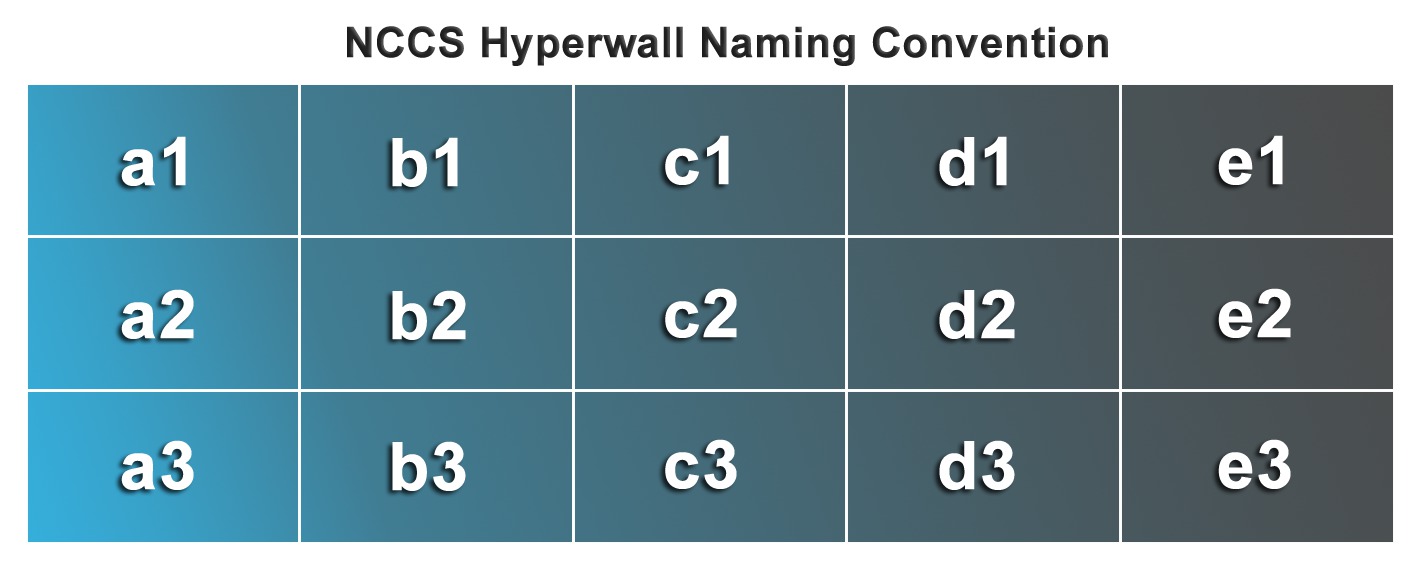
NCCS Hyperwall Show: Push in with GEOS-5 Modeled Clouds at 3.5-km Global Resolution and 10 Minute Interval
This version of the visualization was created for display on the NASA Center for Climate Science (NCCS.) hyperwall. This hyperwall is a set of 15 tiled high definition displays constisting of 5 displays across by 3 displays down. The full resolution of all combined displays is 6840 pixels accross by 2304 pixels down. This movie was rendered at full resolution, then diced up into images for display on each screen.
This visualization is similar to a visualization shown at the Supercomputing 2009 conference available in entry #3659. The differences between that one and this one are: resolution, aspect ratio, and camera path (due to the aspect).
Visualization Credits
Greg Shirah (NASA/GSFC): Lead Animator
Michelle Williams (UMBC): Producer
William Putman (NASA/GSFC): Scientist
Max J. Suarez (NASA/GSFC): Scientist
Eric Sokolowsky (GST): Project Support
Michelle Williams (UMBC): Producer
William Putman (NASA/GSFC): Scientist
Max J. Suarez (NASA/GSFC): Scientist
Eric Sokolowsky (GST): Project Support
Please give credit for this item to:
NASA/Goddard Space Flight Center Scientific Visualization Studio The Blue Marble Next Generation data is courtesy of Reto Stockli (NASA/GSFC) and NASA's Earth Observatory.
NASA/Goddard Space Flight Center Scientific Visualization Studio The Blue Marble Next Generation data is courtesy of Reto Stockli (NASA/GSFC) and NASA's Earth Observatory.
Short URL to share this page:
https://svs.gsfc.nasa.gov/3722
Mission:
Terra
Data Used:
Note: While we identify the data sets used in these visualizations, we do not store any further details nor the data sets themselves on our site.
This item is part of this series:
NCCS Dedication 2010
Keywords:
DLESE >> Atmospheric science
SVS >> HDTV
SVS >> Simulation
GCMD >> Earth Science >> Atmosphere >> Clouds
SVS >> Model Data
SVS >> Global Climate Models
SVS >> Hyperwall
SVS >> iPod
SVS >> For Educators
SVS >> Water Cycle >> Condensation
SVS >> Atmosphere >> Humidity
SVS >> Climate >> Precipitation
NASA Science >> Earth
SVS >> Presentation
SVS >> sc09
GCMD keywords can be found on the Internet with the following citation: Olsen, L.M., G. Major, K. Shein, J. Scialdone, S. Ritz, T. Stevens, M. Morahan, A. Aleman, R. Vogel, S. Leicester, H. Weir, M. Meaux, S. Grebas, C.Solomon, M. Holland, T. Northcutt, R. A. Restrepo, R. Bilodeau, 2013. NASA/Global Change Master Directory (GCMD) Earth Science Keywords. Version 8.0.0.0.0
https://svs.gsfc.nasa.gov/3722
Mission:
Terra
Data Used:
Terra and Aqua/MODIS/Blue Marble: Next Generation also referred to as: BMNG
Credit:
The Blue Marble data is courtesy of Reto Stockli (NASA/GSFC).
The Blue Marble data is courtesy of Reto Stockli (NASA/GSFC).
GEOS-5 Atmospheric Model on the Cubed-Sphere also referred to as: GEOS-5 Cubed-Sphere
Model - NASA GMAO - 01/02/2009
The model is the GEOS-5 atmospheric model on the cubed-sphere, run at 14-km global resolution for 30-days. GEOS-5 is described here http://gmao.gsfc.nasa.gov/systems/geos5/ and the cubed-sphere work is described here http://sivo.gsfc.nasa.gov/cubedsphere_overview.html.
This item is part of this series:
NCCS Dedication 2010
Keywords:
DLESE >> Atmospheric science
SVS >> HDTV
SVS >> Simulation
GCMD >> Earth Science >> Atmosphere >> Clouds
SVS >> Model Data
SVS >> Global Climate Models
SVS >> Hyperwall
SVS >> iPod
SVS >> For Educators
SVS >> Water Cycle >> Condensation
SVS >> Atmosphere >> Humidity
SVS >> Climate >> Precipitation
NASA Science >> Earth
SVS >> Presentation
SVS >> sc09
GCMD keywords can be found on the Internet with the following citation: Olsen, L.M., G. Major, K. Shein, J. Scialdone, S. Ritz, T. Stevens, M. Morahan, A. Aleman, R. Vogel, S. Leicester, H. Weir, M. Meaux, S. Grebas, C.Solomon, M. Holland, T. Northcutt, R. A. Restrepo, R. Bilodeau, 2013. NASA/Global Change Master Directory (GCMD) Earth Science Keywords. Version 8.0.0.0.0


