Earth
ID: 3657
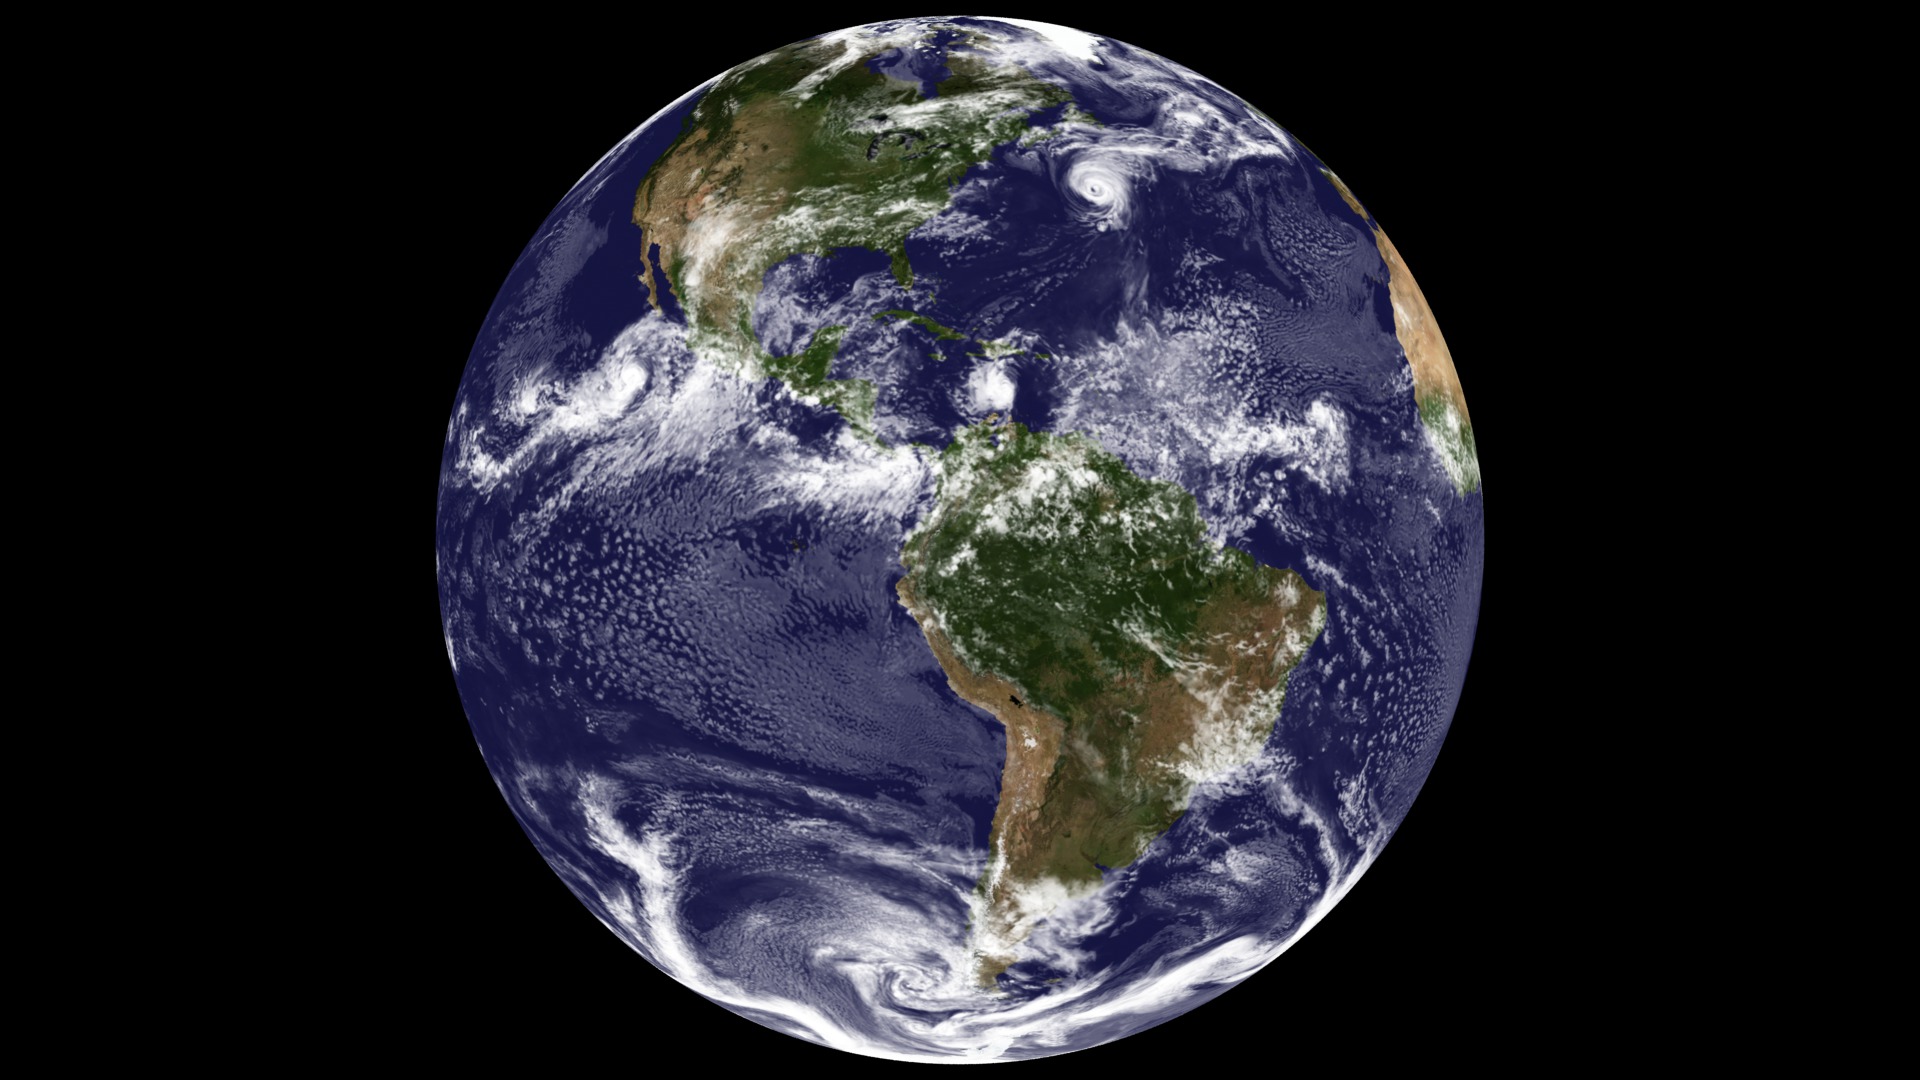
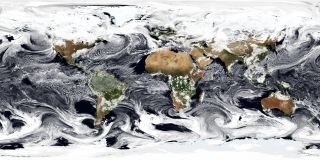
This visualization shows clouds from a simulation using the Goddard Earth Observing System Model, Verison 5 (GEOS-5). The global atmospheric simulation running at 7 km per grid cell covered the period from August 17, 2009 at 21 zulu, through August 26, 2009 at 21 zulu at 30 minute intervals. This visualization was designed to closely match a GOES satellite image for comparison purposes.


GEOS-5 Modeled Clouds at 7-km Global Resolution
Visualization Credits
Greg Shirah (NASA/GSFC): Lead Animator
William Putman (NASA/GSFC): Scientist
Max J. Suarez (NASA/GSFC): Scientist
William Putman (NASA/GSFC): Scientist
Max J. Suarez (NASA/GSFC): Scientist
Please give credit for this item to:
NASA/Goddard Space Flight Center Scientific Visualization Studio The Blue Marble Next Generation data is courtesy of Reto Stockli (NASA/GSFC) and NASA's Earth Observatory.
NASA/Goddard Space Flight Center Scientific Visualization Studio The Blue Marble Next Generation data is courtesy of Reto Stockli (NASA/GSFC) and NASA's Earth Observatory.
Short URL to share this page:
https://svs.gsfc.nasa.gov/3657
Mission:
Terra
Data Used:
Note: While we identify the data sets used in these visualizations, we do not store any further details nor the data sets themselves on our site.
Keywords:
DLESE >> Atmospheric science
SVS >> HDTV
SVS >> Simulation
GCMD >> Earth Science >> Atmosphere >> Clouds
SVS >> Model Data
SVS >> Global Climate Models
SVS >> Hyperwall
SVS >> iPod
SVS >> For Educators
SVS >> Earth >> Texas >> Houston
NASA Science >> Earth
GCMD keywords can be found on the Internet with the following citation: Olsen, L.M., G. Major, K. Shein, J. Scialdone, S. Ritz, T. Stevens, M. Morahan, A. Aleman, R. Vogel, S. Leicester, H. Weir, M. Meaux, S. Grebas, C.Solomon, M. Holland, T. Northcutt, R. A. Restrepo, R. Bilodeau, 2013. NASA/Global Change Master Directory (GCMD) Earth Science Keywords. Version 8.0.0.0.0
https://svs.gsfc.nasa.gov/3657
Mission:
Terra
Data Used:
Terra and Aqua/MODIS/Blue Marble: Next Generation also referred to as: BMNG
1/1/2004 - 12/31/2004
Credit:
The Blue Marble data is courtesy of Reto Stockli (NASA/GSFC).
The Blue Marble data is courtesy of Reto Stockli (NASA/GSFC).
GEOS-5 Atmospheric Model on the Cubed-Sphere also referred to as: GEOS-5 Cubed-Sphere
Model - NASA GMAO - 08-17-2009 through 08-21-2009
The model is the GEOS-5 atmospheric model on the cubed-sphere, run at 14-km global resolution for 30-days. GEOS-5 is described here http://gmao.gsfc.nasa.gov/systems/geos5/ and the cubed-sphere work is described here http://sivo.gsfc.nasa.gov/cubedsphere_overview.html.
Keywords:
DLESE >> Atmospheric science
SVS >> HDTV
SVS >> Simulation
GCMD >> Earth Science >> Atmosphere >> Clouds
SVS >> Model Data
SVS >> Global Climate Models
SVS >> Hyperwall
SVS >> iPod
SVS >> For Educators
SVS >> Earth >> Texas >> Houston
NASA Science >> Earth
GCMD keywords can be found on the Internet with the following citation: Olsen, L.M., G. Major, K. Shein, J. Scialdone, S. Ritz, T. Stevens, M. Morahan, A. Aleman, R. Vogel, S. Leicester, H. Weir, M. Meaux, S. Grebas, C.Solomon, M. Holland, T. Northcutt, R. A. Restrepo, R. Bilodeau, 2013. NASA/Global Change Master Directory (GCMD) Earth Science Keywords. Version 8.0.0.0.0


