Earth
ID: 3638
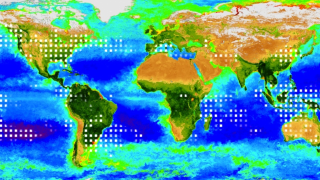
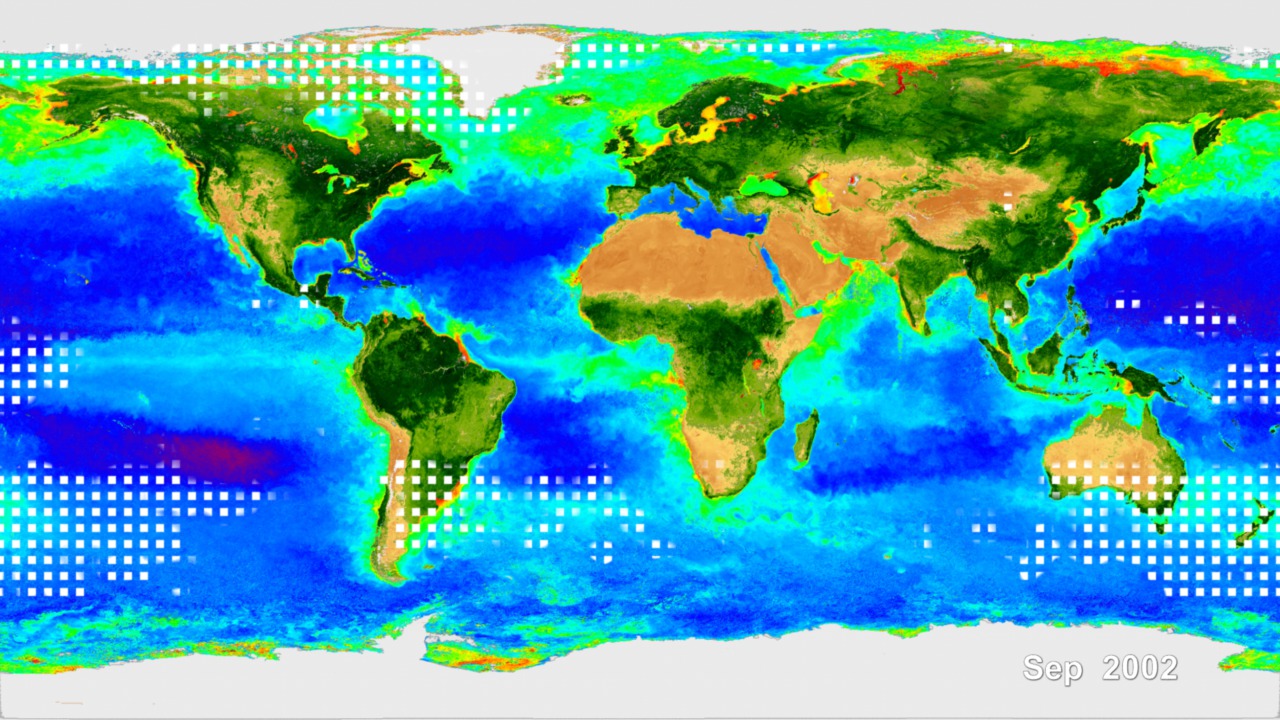
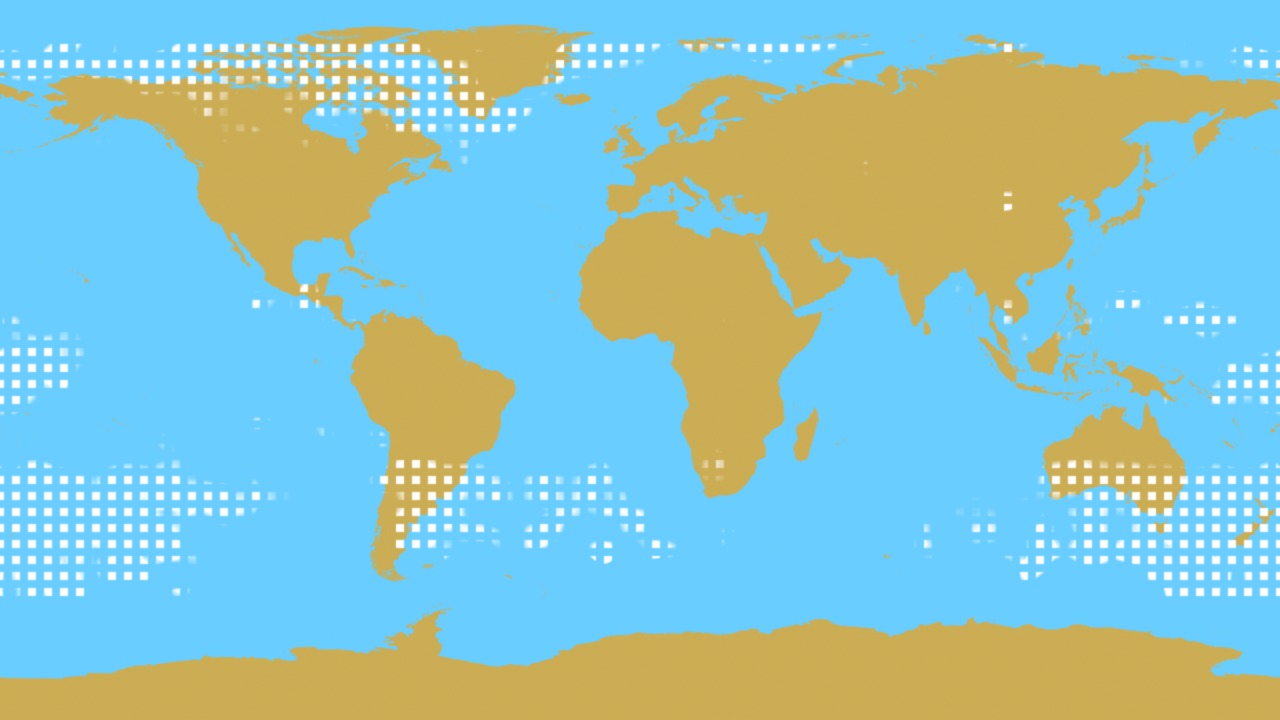
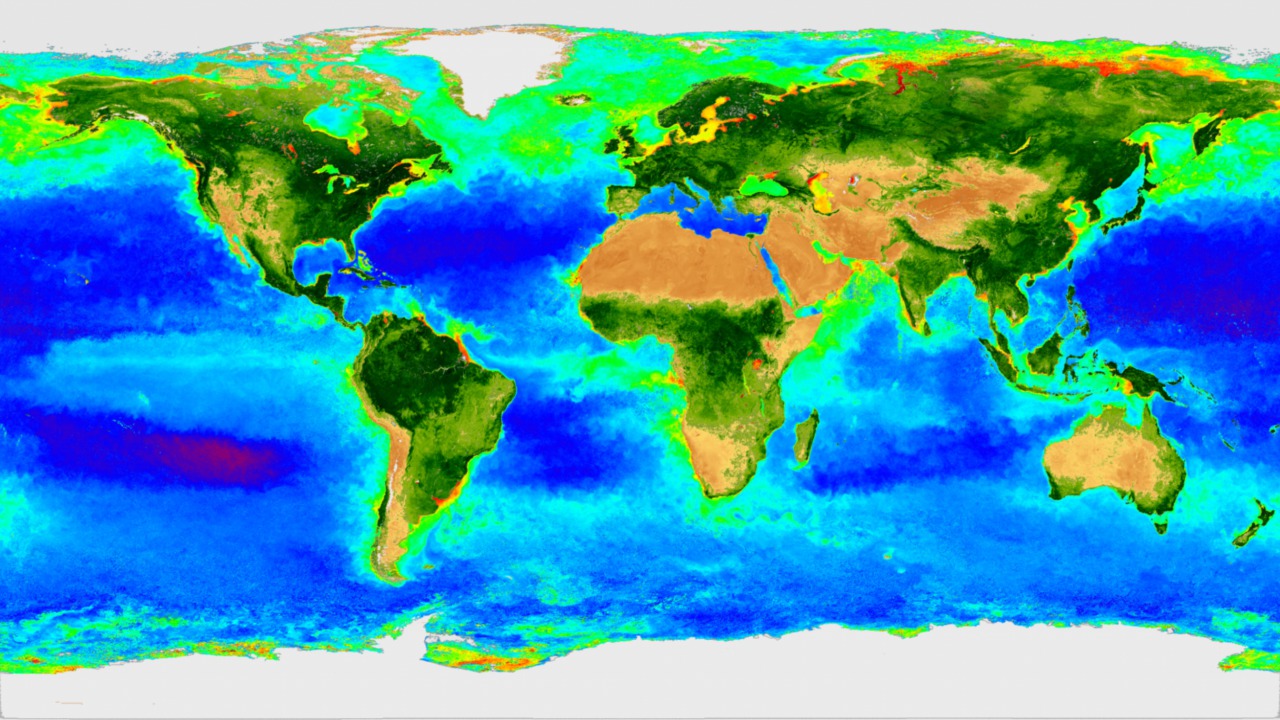
This animation shows the correspondence between the drawdown of tropospheric carbon dioxide in the earth's atmosphere, and the seasonal variation of the biosphere of the earth. The pattern of white squares indicates regions where the concentration of tropospheric CO2 is higher than the trend, while regions devoid of the squares are areas where the CO2 concentrations are lower than the trend. The trend was calculated by a least-squares line fit to a moving 8-day global average of CO2 concentration provided by the AIRS instrument on the Aqua satellite, and increases over the course of the animation (Sept. 2002-Sept. 2006) from 374 ppm to 383 ppm. The biosphere data is provided by the SeaWiFS instrument aboard the SeaStar satellite.
Correlation Between Tropospheric Carbon Dioxide Concentration and Seasonal Variation of the Biosphere
During spring and summer months, the consumption of CO2 through plant respiration increases, reducing the concentration of CO2 (the white squares) over the more productive areas. In the animation, this is seen as a tendency for the CO2 concentration to drop below the trend over areas of deeper green. The cycle is especially apparent in the Northern Hemisphere.
Related
Visualization Credits
Please give credit for this item to:
NASA/Goddard Space Flight Center, The SeaWiFS Project and GeoEye, Scientific Visualization Studio. NOTE: All SeaWiFS images and data presented on this web site are for research and educational use only. All commercial use of SeaWiFS data must be coordinated with GeoEye (NOTE: In January 2013, DigitalGlobe and GeoEye combined to become DigitalGlobe).
NASA/Goddard Space Flight Center, The SeaWiFS Project and GeoEye, Scientific Visualization Studio. NOTE: All SeaWiFS images and data presented on this web site are for research and educational use only. All commercial use of SeaWiFS data must be coordinated with GeoEye (NOTE: In January 2013, DigitalGlobe and GeoEye combined to become DigitalGlobe).
Short URL to share this page:
https://svs.gsfc.nasa.gov/3638
Data Used:
Note: While we identify the data sets used in these visualizations, we do not store any further details nor the data sets themselves on our site.
Keywords:
SVS >> Carbon Absorption
SVS >> Carbon Dioxide
SVS >> HDTV
SVS >> Transpiration
GCMD >> Earth Science >> Agriculture
GCMD >> Earth Science >> Biosphere >> Ecological Dynamics >> Respiration
SVS >> Hyperwall
SVS >> Copenhagen
SVS >> For Educators
SVS >> Global Vegetation
NASA Science >> Earth
GCMD keywords can be found on the Internet with the following citation: Olsen, L.M., G. Major, K. Shein, J. Scialdone, S. Ritz, T. Stevens, M. Morahan, A. Aleman, R. Vogel, S. Leicester, H. Weir, M. Meaux, S. Grebas, C.Solomon, M. Holland, T. Northcutt, R. A. Restrepo, R. Bilodeau, 2013. NASA/Global Change Master Directory (GCMD) Earth Science Keywords. Version 8.0.0.0.0
https://svs.gsfc.nasa.gov/3638
Data Used:
Aqua/AIRS
For more information on the Atmospheric Infrared Sounder, click http://www-airs.jpl.nasa.gov/
SeaStar/SeaWiFS
NOTE: All SeaWiFS images and data presented on this web site are for research and educational use only. All commercial use of SeaWiFS data must be coordinated with GeoEye
Credit:
NASA/Goddard Space Flight Center, The SeaWiFS Project and GeoEye, Scientific Visualization Studio. NOTE: All SeaWiFS images and data presented on this web site are for research and educational use only. All commercial use of SeaWiFS data must be coordinated with GeoEye (NOTE: In January 2013, DigitalGlobe and GeoEye combined to become one DigitalGlobe.).
NASA/Goddard Space Flight Center, The SeaWiFS Project and GeoEye, Scientific Visualization Studio. NOTE: All SeaWiFS images and data presented on this web site are for research and educational use only. All commercial use of SeaWiFS data must be coordinated with GeoEye (NOTE: In January 2013, DigitalGlobe and GeoEye combined to become one DigitalGlobe.).
Keywords:
SVS >> Carbon Absorption
SVS >> Carbon Dioxide
SVS >> HDTV
SVS >> Transpiration
GCMD >> Earth Science >> Agriculture
GCMD >> Earth Science >> Biosphere >> Ecological Dynamics >> Respiration
SVS >> Hyperwall
SVS >> Copenhagen
SVS >> For Educators
SVS >> Global Vegetation
NASA Science >> Earth
GCMD keywords can be found on the Internet with the following citation: Olsen, L.M., G. Major, K. Shein, J. Scialdone, S. Ritz, T. Stevens, M. Morahan, A. Aleman, R. Vogel, S. Leicester, H. Weir, M. Meaux, S. Grebas, C.Solomon, M. Holland, T. Northcutt, R. A. Restrepo, R. Bilodeau, 2013. NASA/Global Change Master Directory (GCMD) Earth Science Keywords. Version 8.0.0.0.0


