A Tour of the Cryosphere 2009
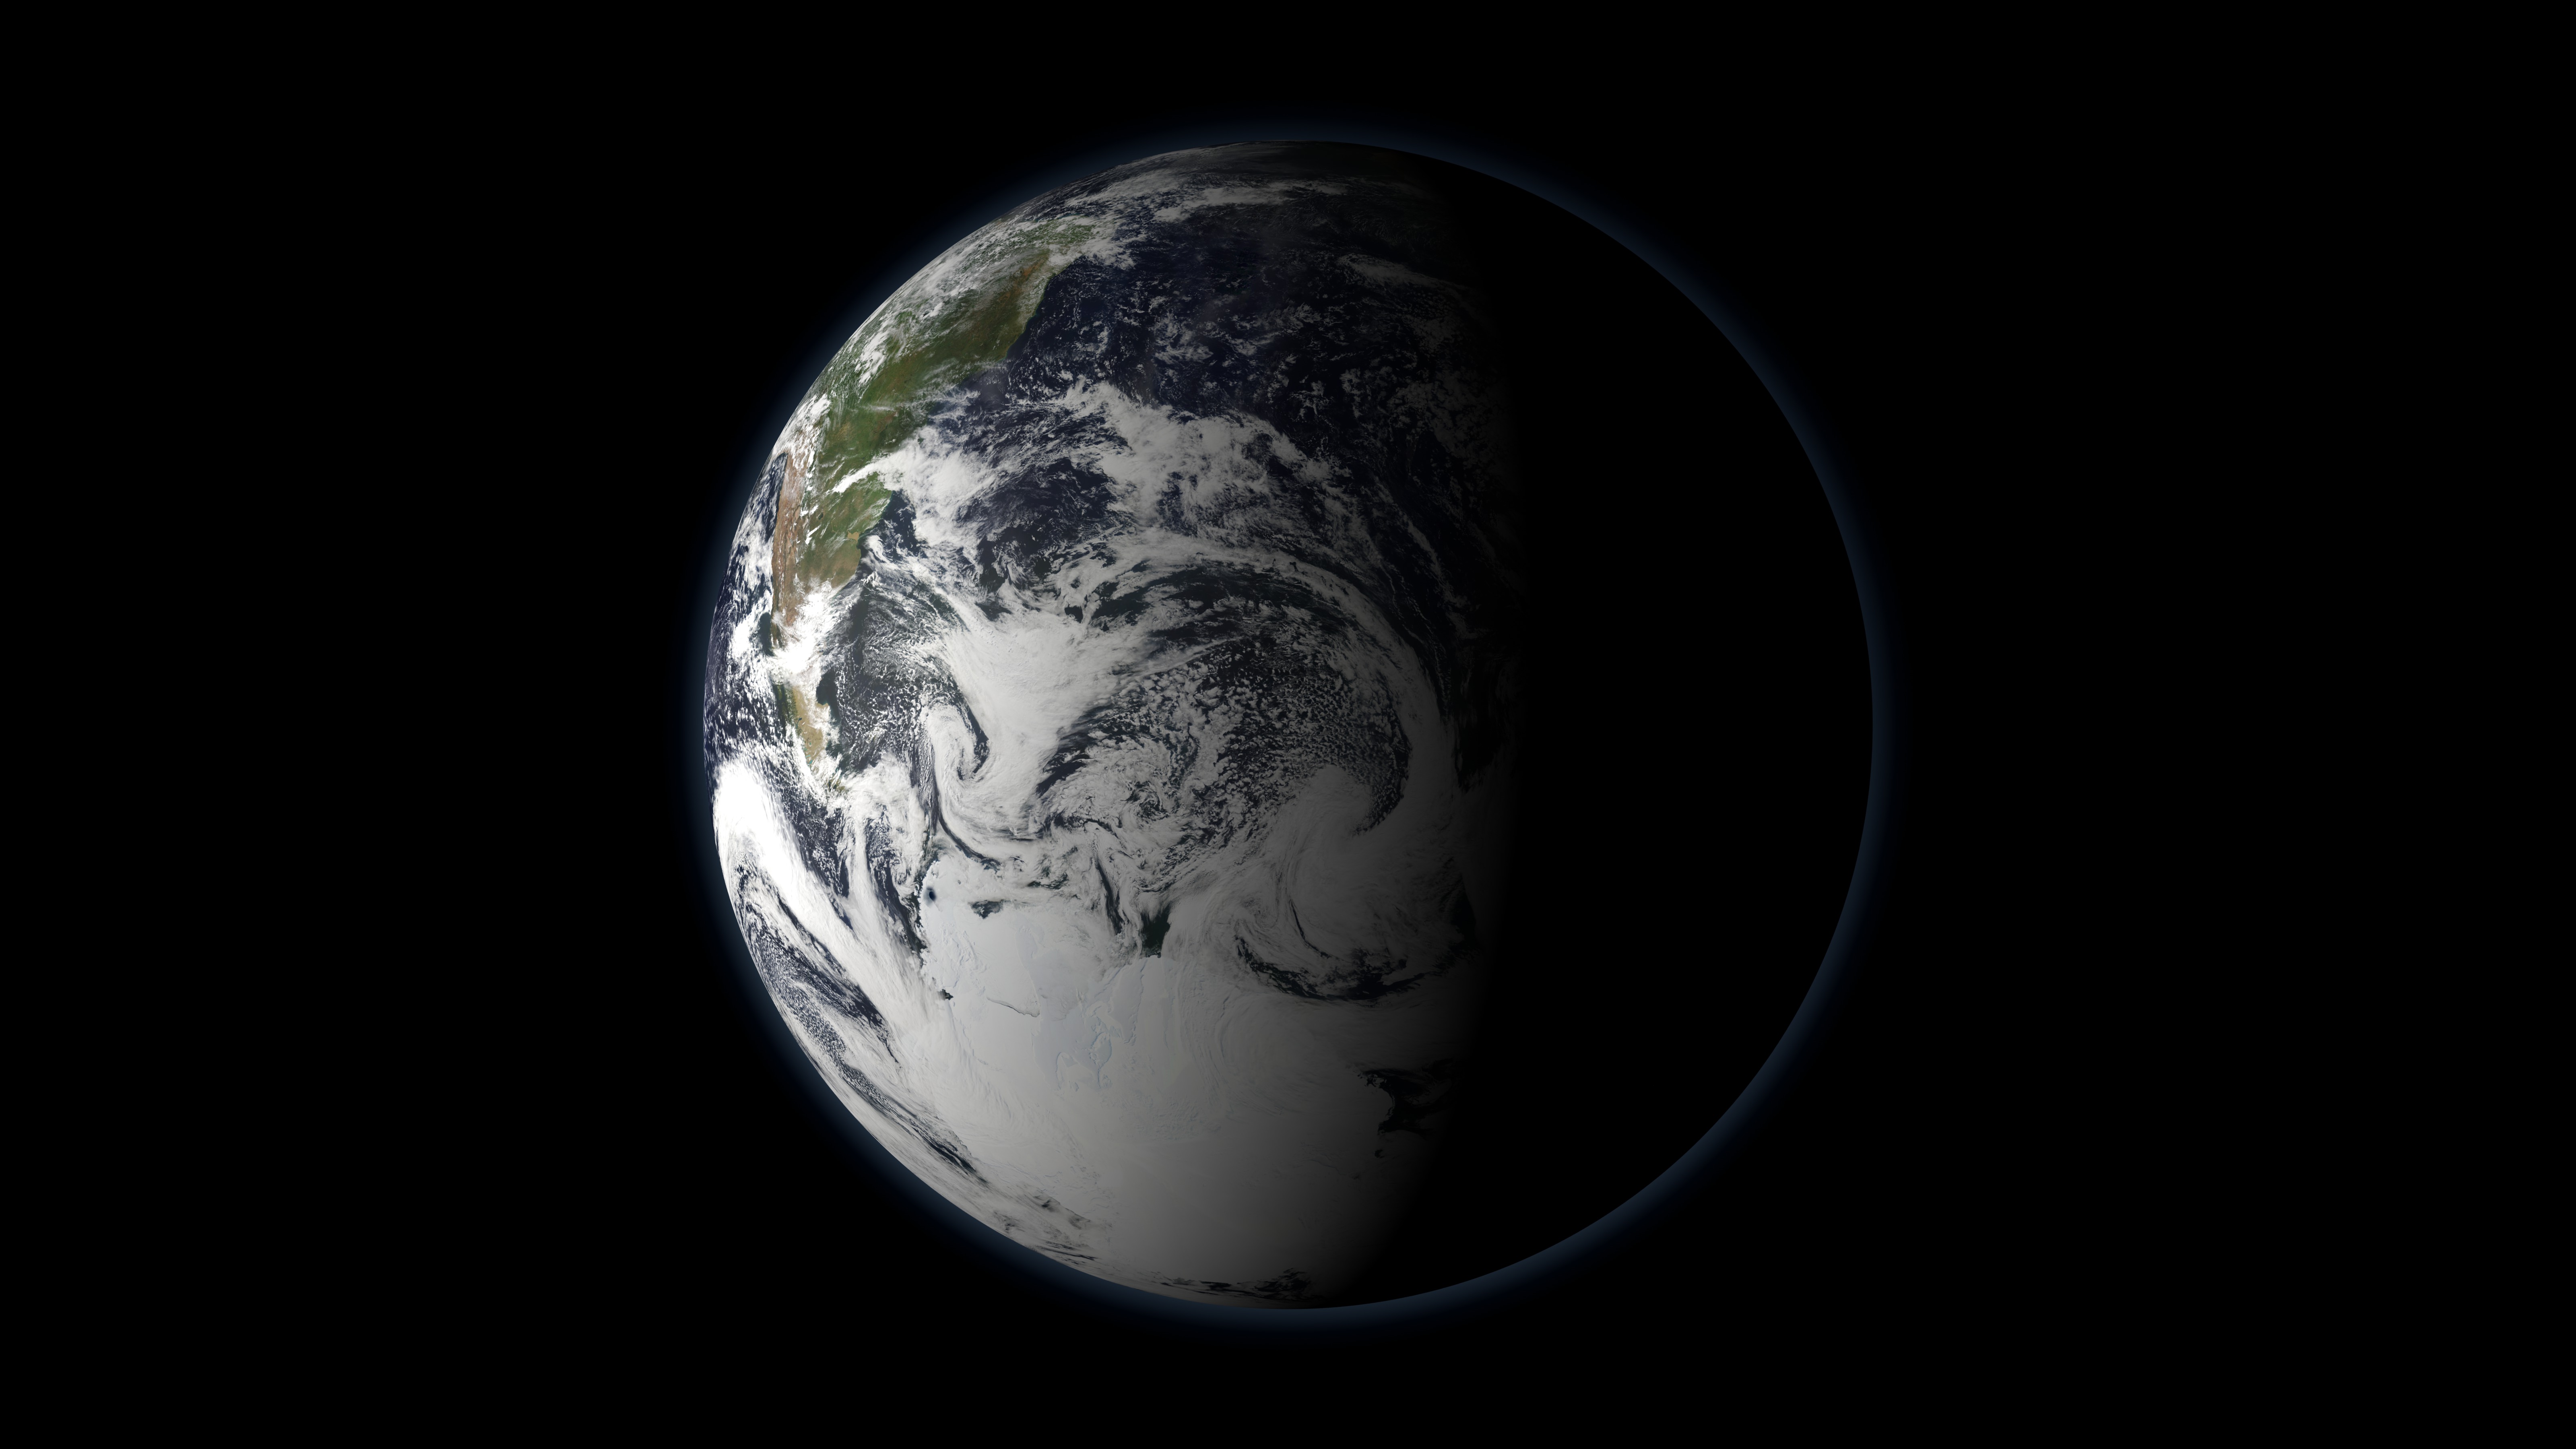
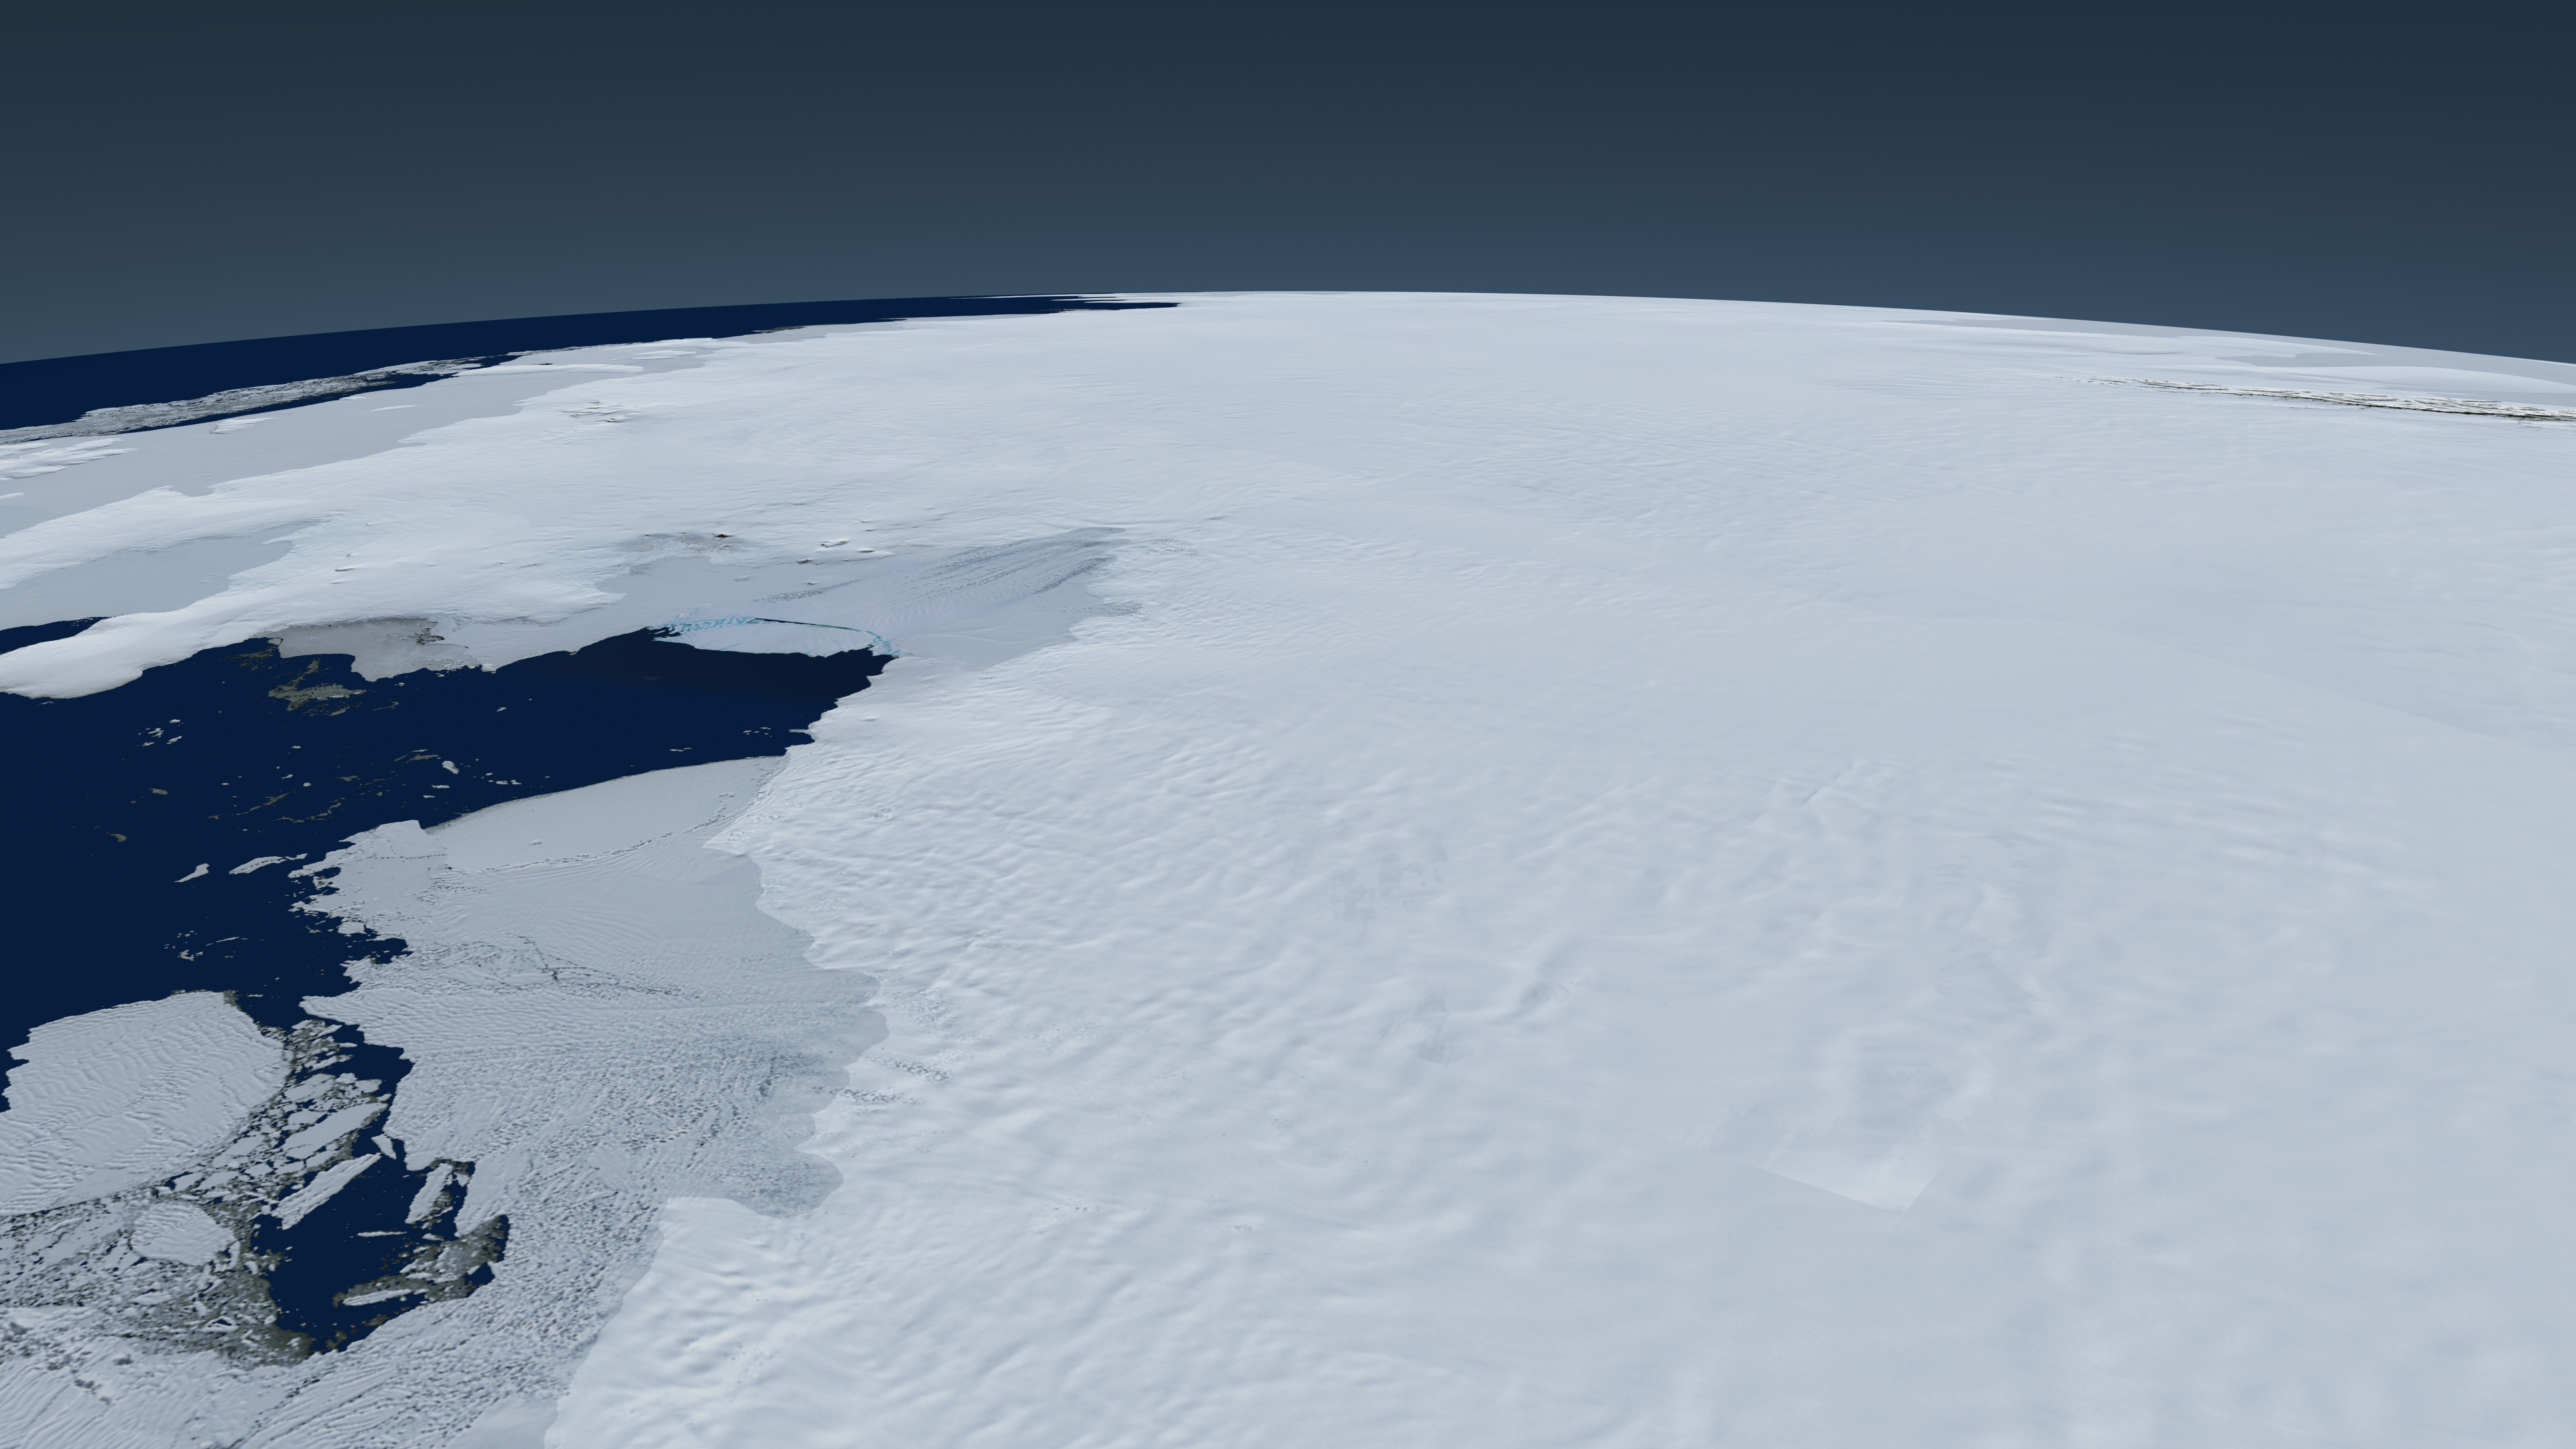
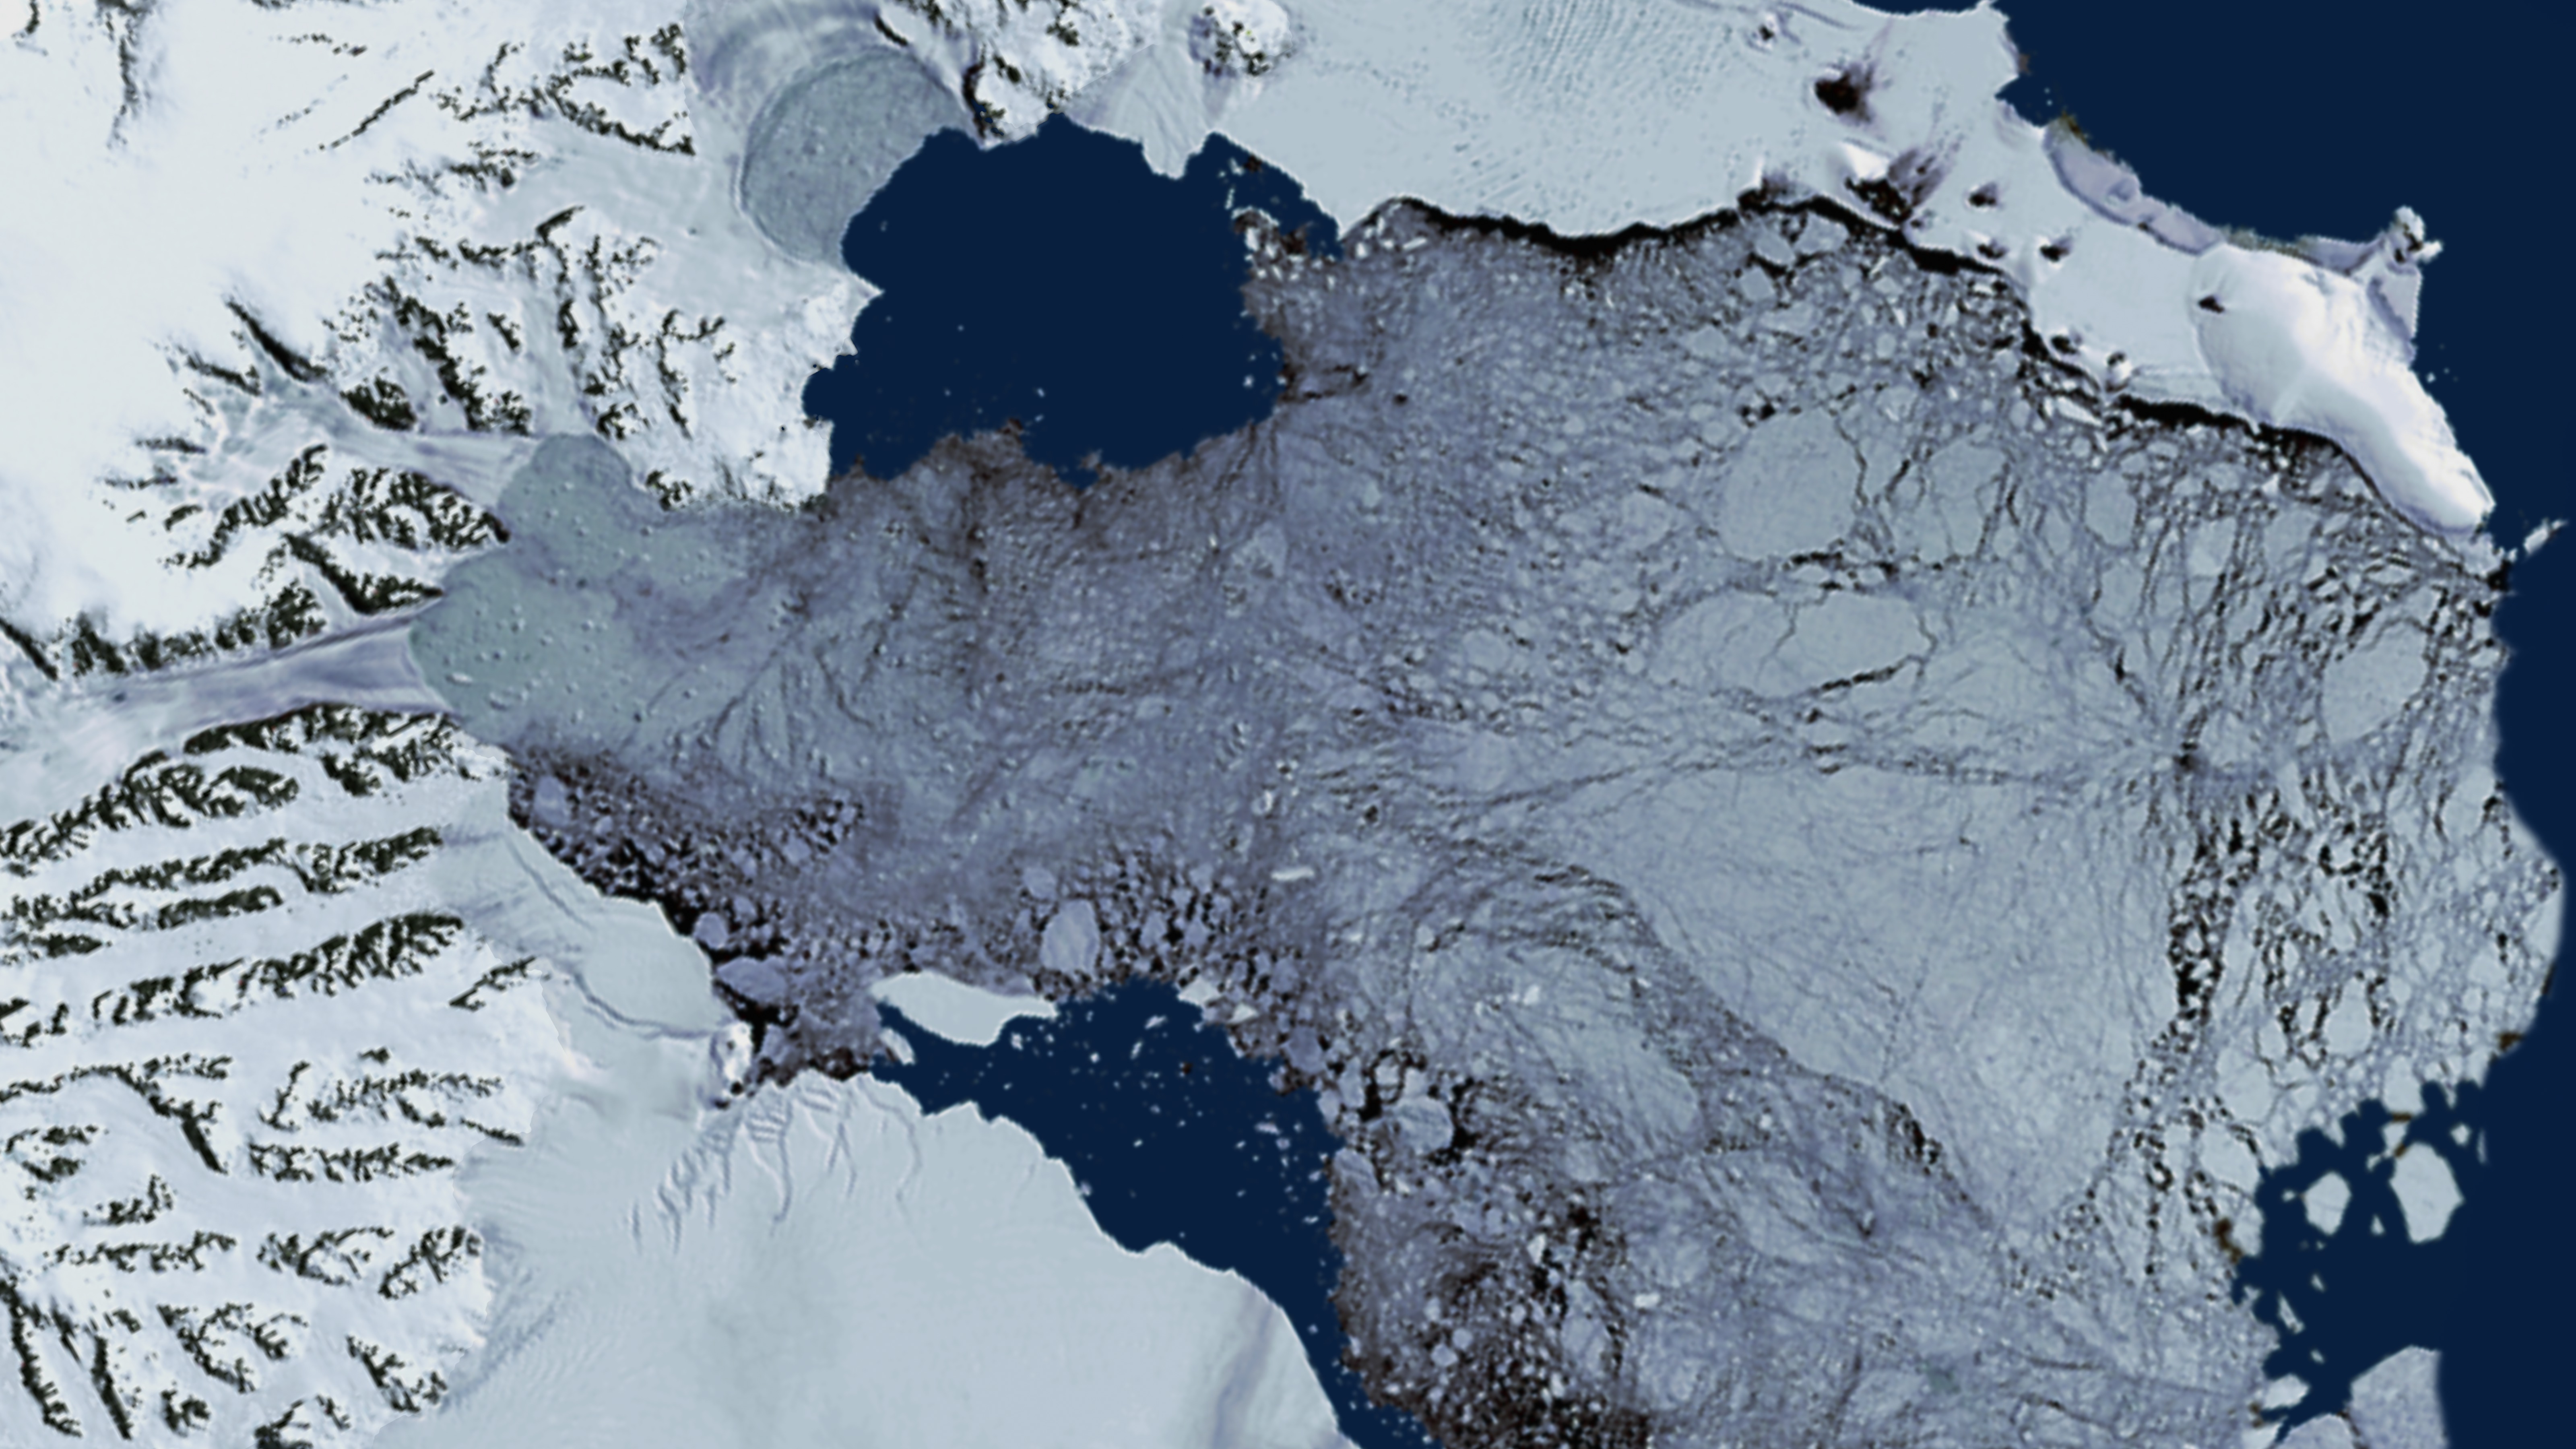
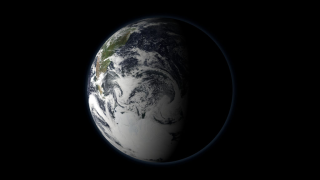
This animation portrays fluctuations in the cryosphere through observations collected from a variety of satellite-based sensors. The animation begins in Antarctica, showing some unique features of the Antarctic landscape found nowhere else on earth. Ice shelves, ice streams, glaciers, and the formation of massive icebergs can be seen clearly in the flyover of the Landsat Image Mosaic of Antarctica. A time series shows the movement of iceberg B15A, an iceberg 295 kilometers in length which broke off of the Ross Ice Shelf in 2000. Moving farther along the coastline, a time series of the Larsen ice shelf shows the collapse of over 3,200 square kilometers ice since January 2002. As we depart from the Antarctic, we see the seasonal change of sea ice and how it nearly doubles the apparent area of the continent during the winter.
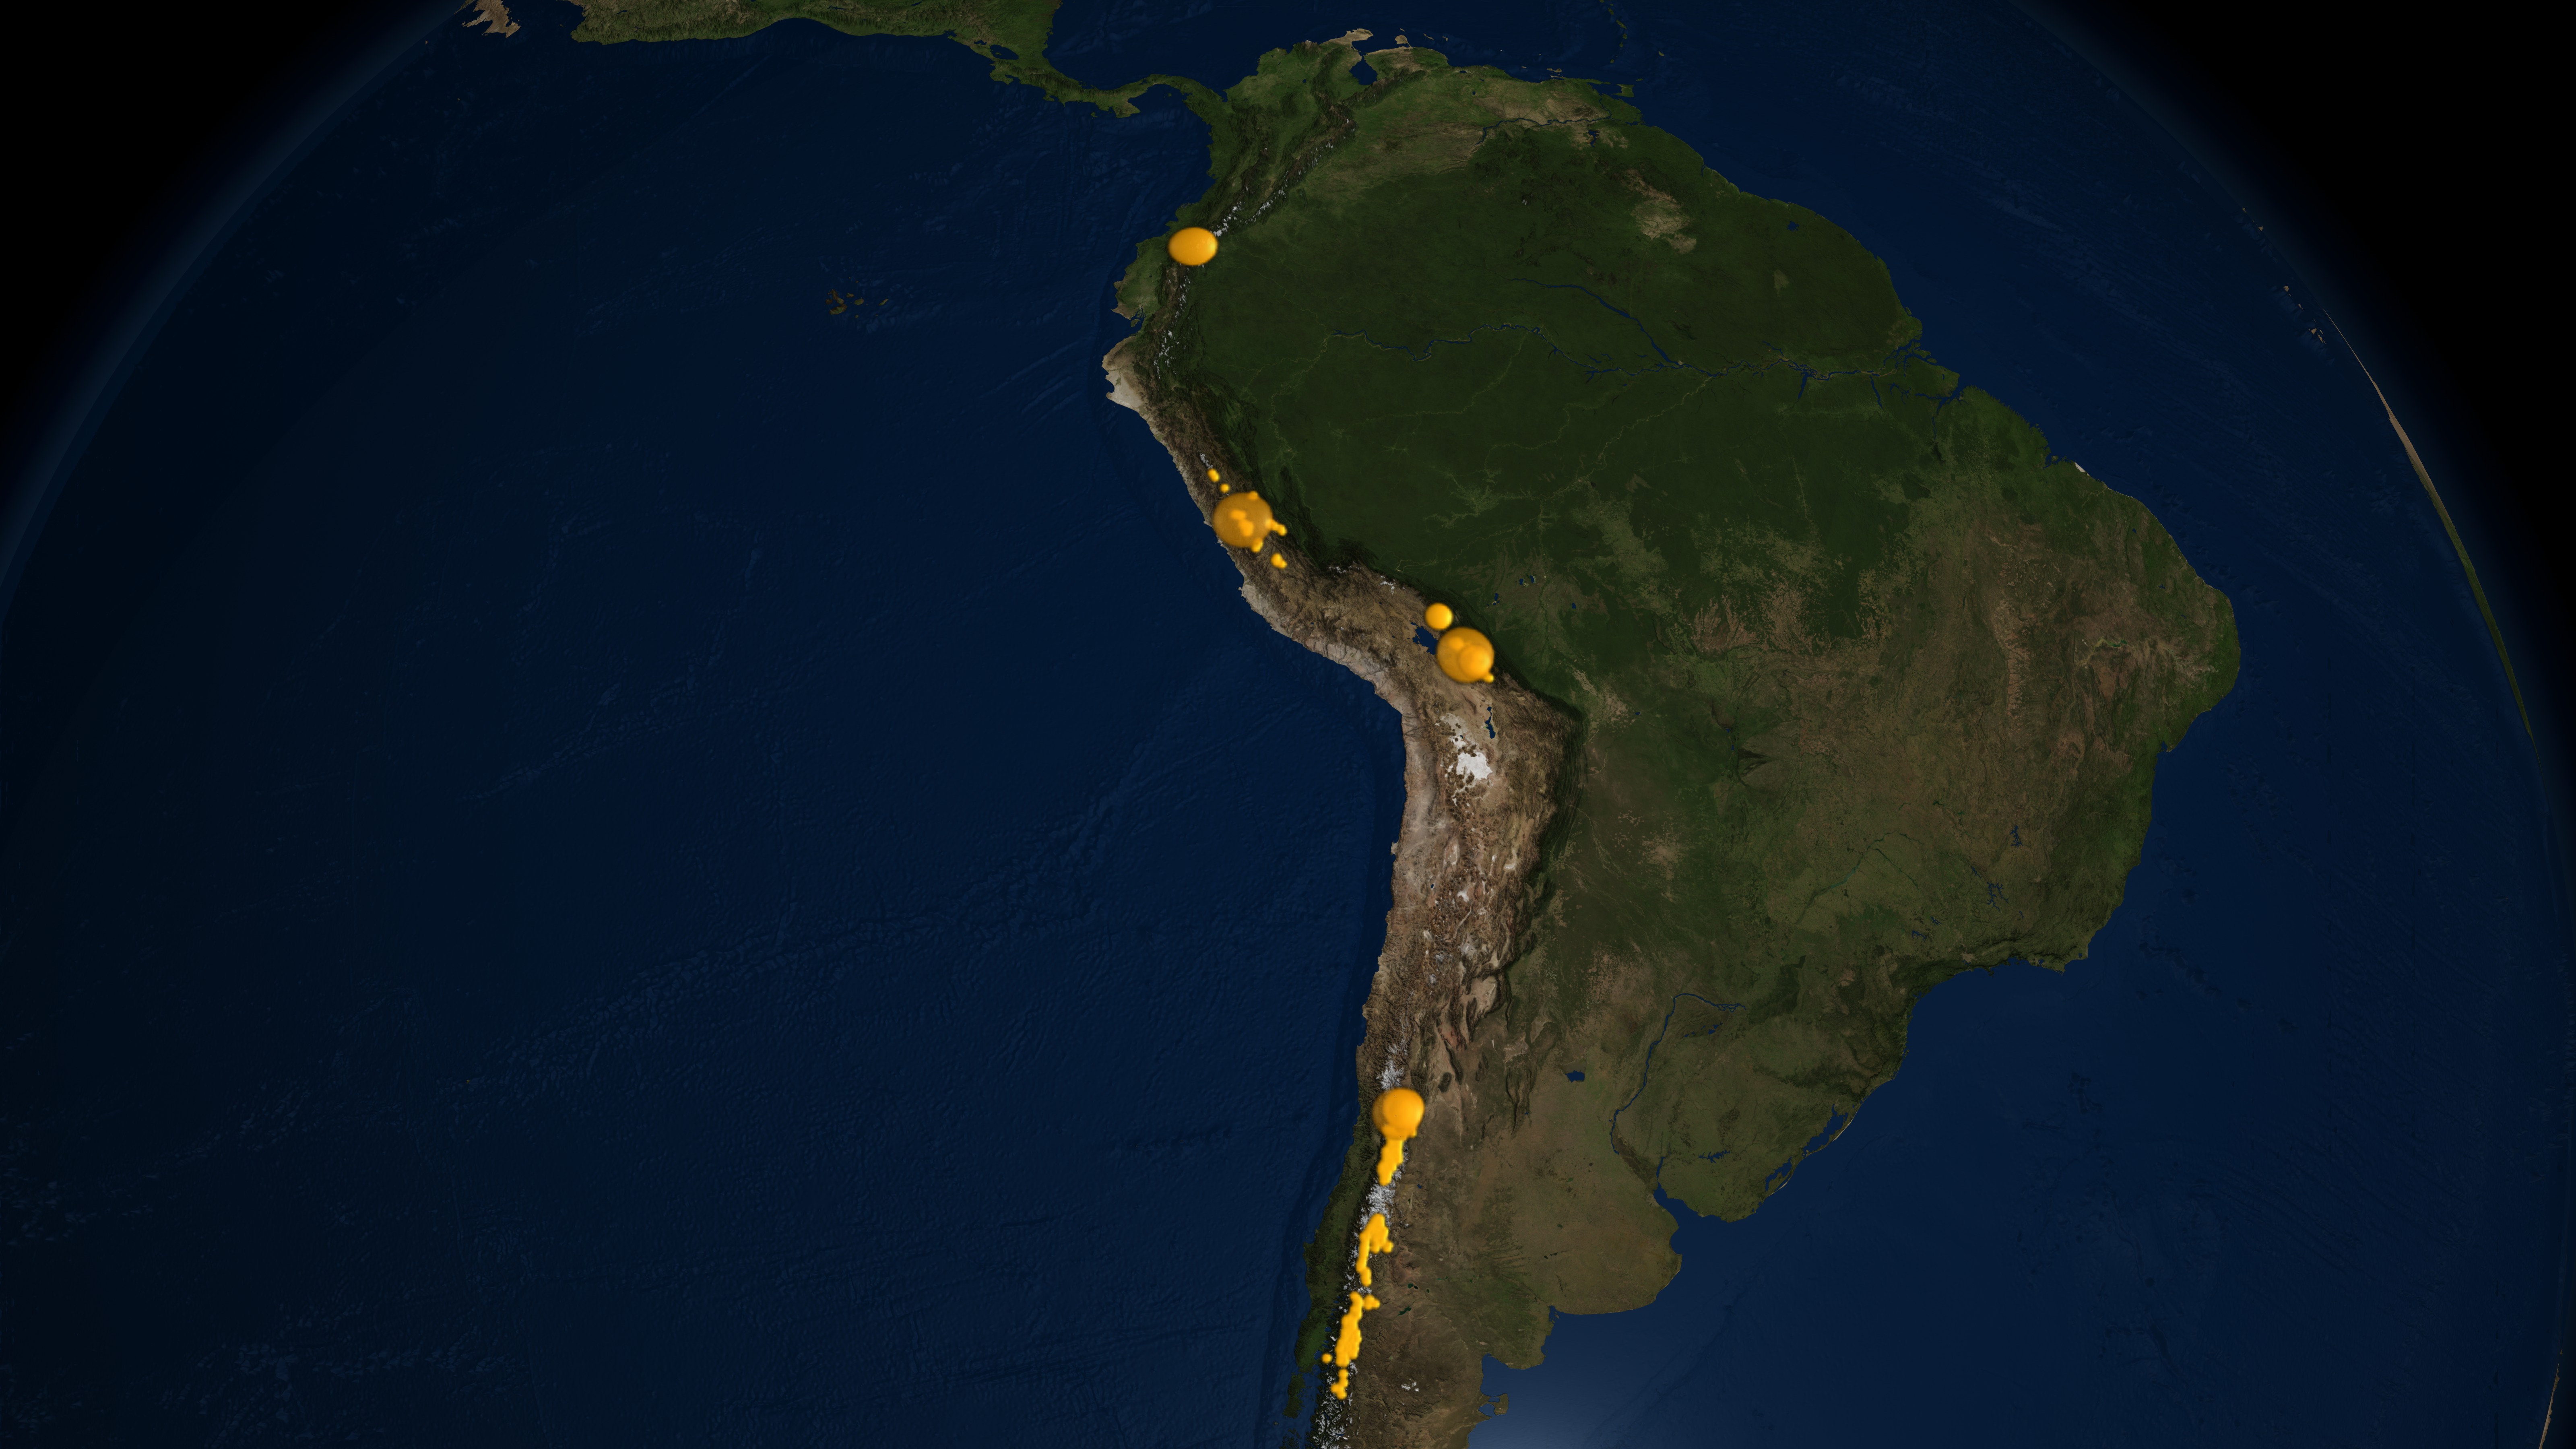
From Antarctica, the animation travels over South America showing glacier locations on this mostly tropical continent. We then move further north to observe daily changes in snow cover over the North American continent. The clouds show winter storms moving across the United States and Canada, leaving trails of snow cover behind. In a close-up view of the western US, we compare the difference in land cover between two years: 2003 when the region received a normal amount of snow and 2002 when little snow was accumulated. The difference in the surrounding vegetation due to the lack of spring melt water from the mountain snow pack is evident.
As the animation moves from the western US to the Arctic region, the areas affected by permafrost are visible. As time marches forward from March to September, the daily snow and sea ice recede and reveal the vast areas of permafrost surrounding the Arctic Ocean.
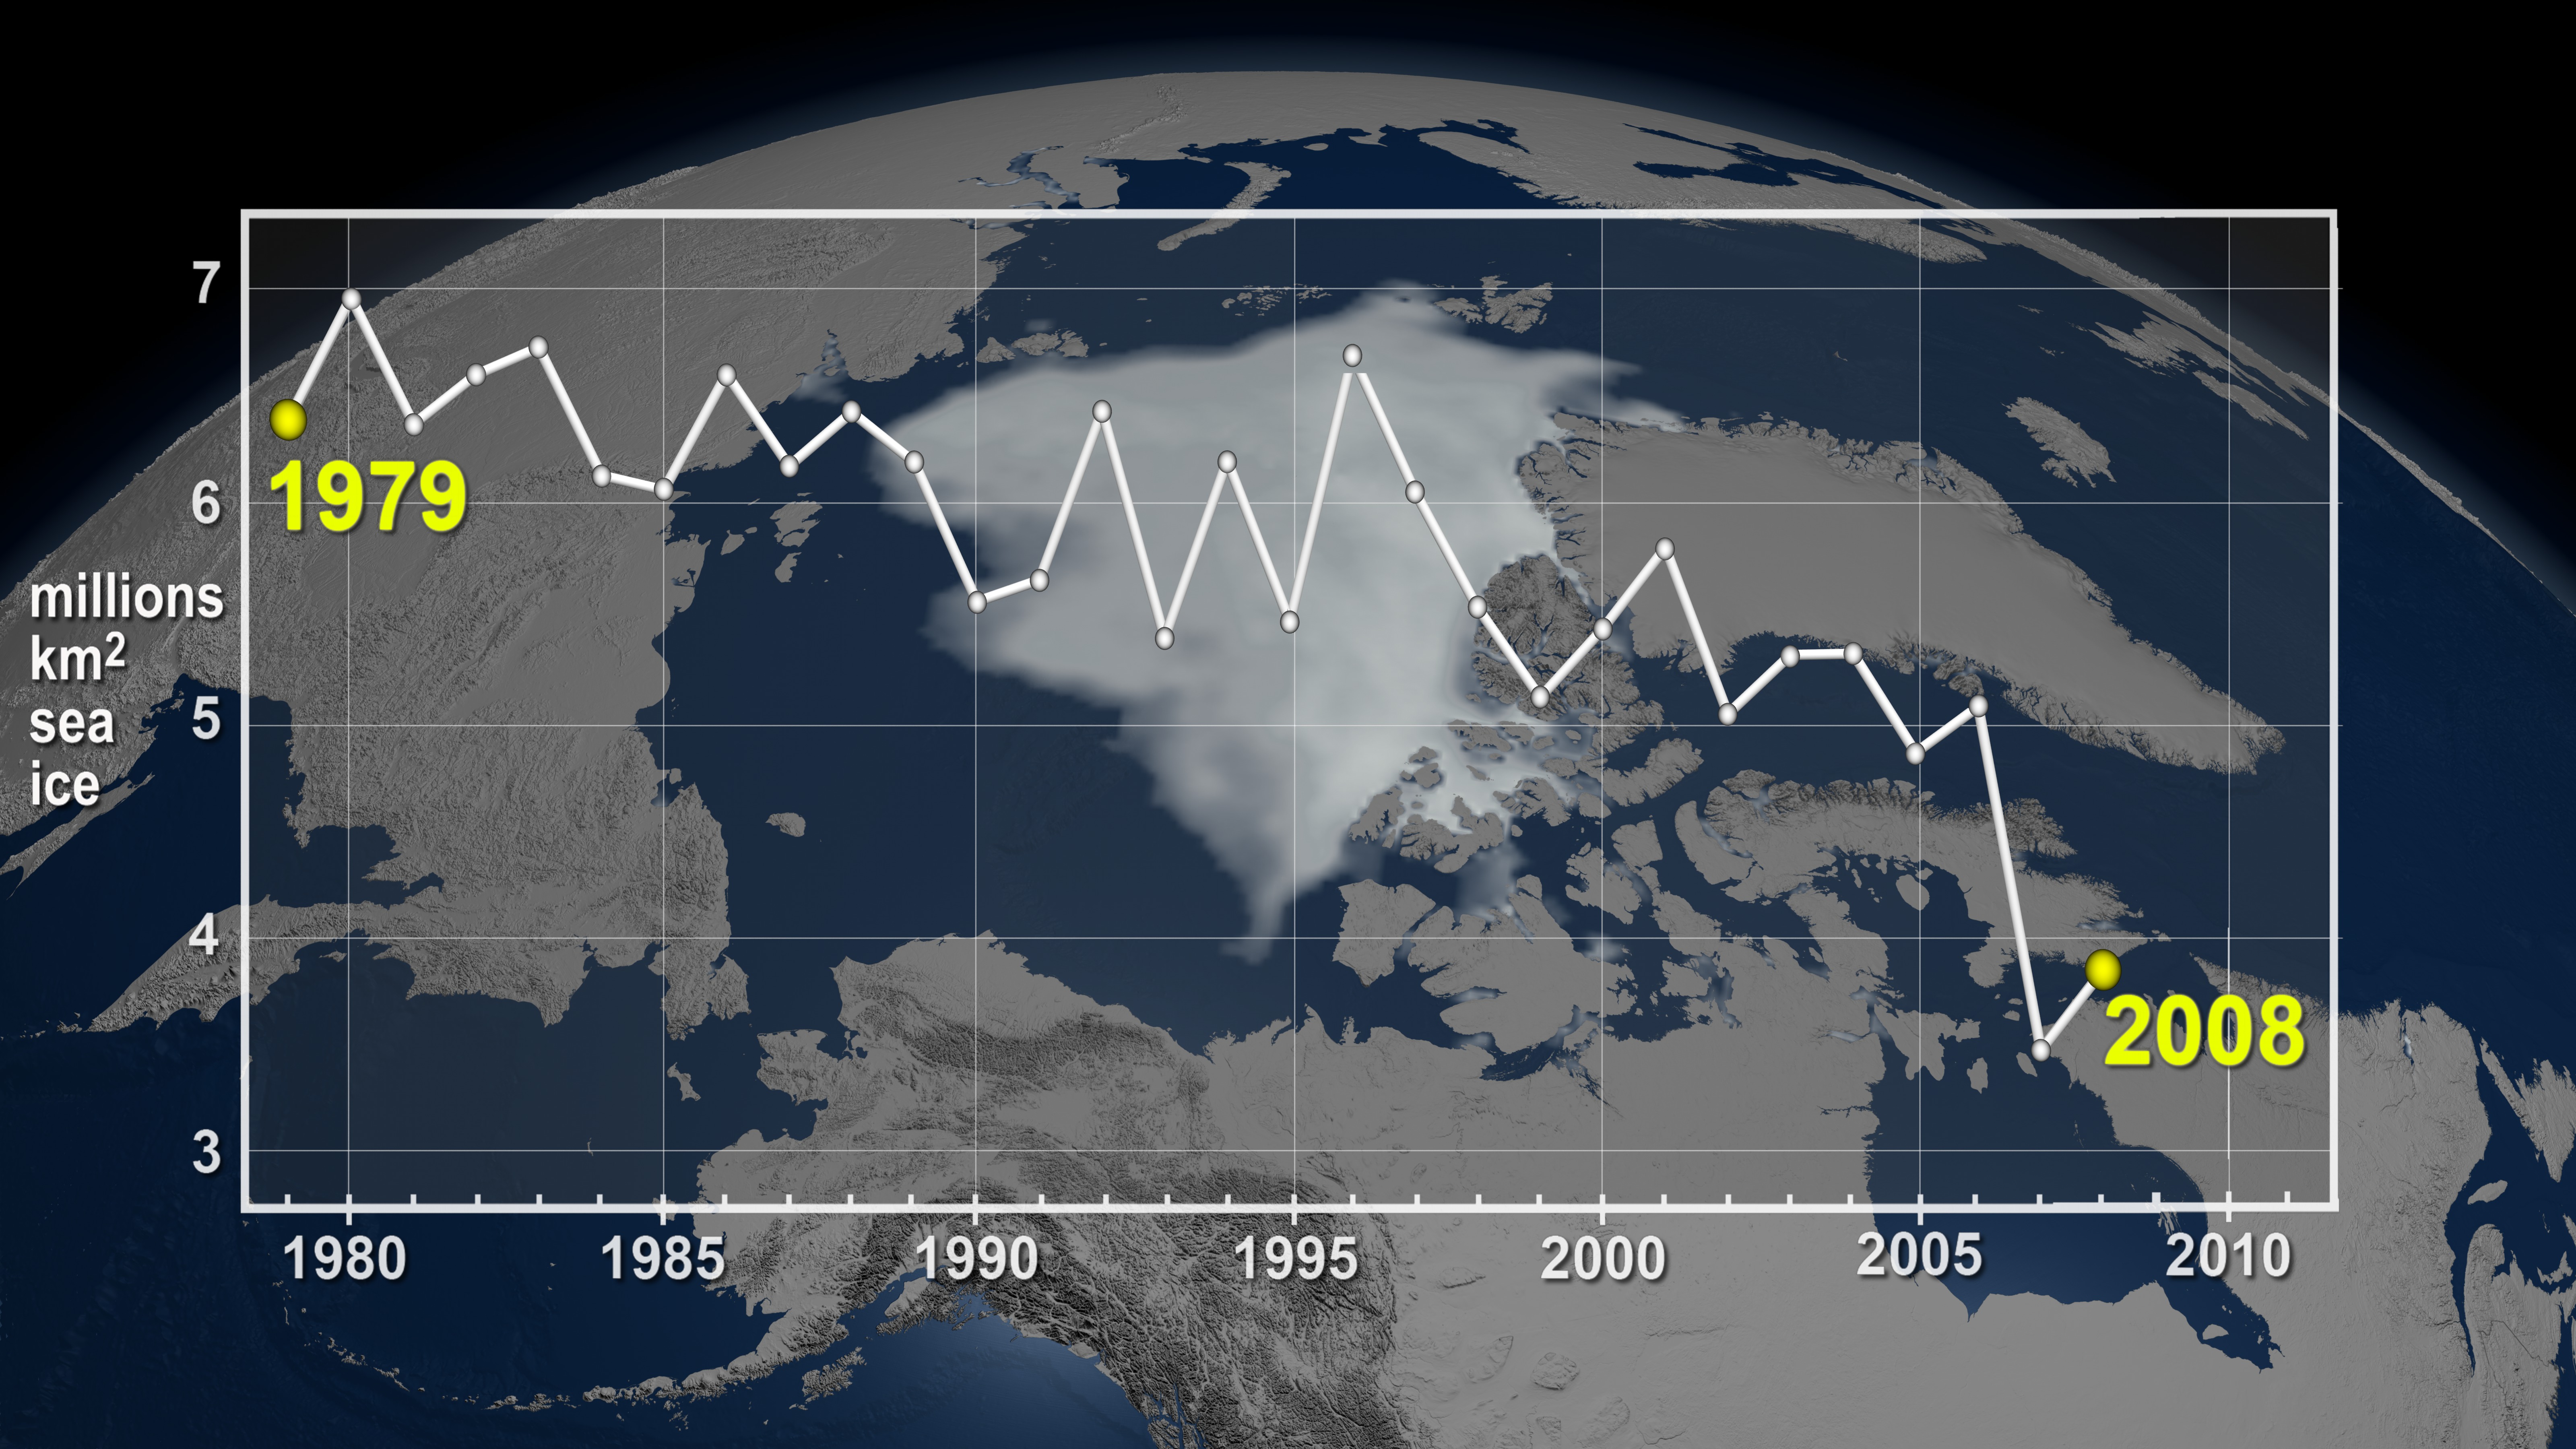
The animation shows a one-year cycle of Arctic sea ice followed by the mean September minimum sea ice for each year from 1979 through 2008. The superimposed graph of the area of Arctic sea ice at this minimum clearly shows the dramatic decrease in Artic sea ice over the last few years.
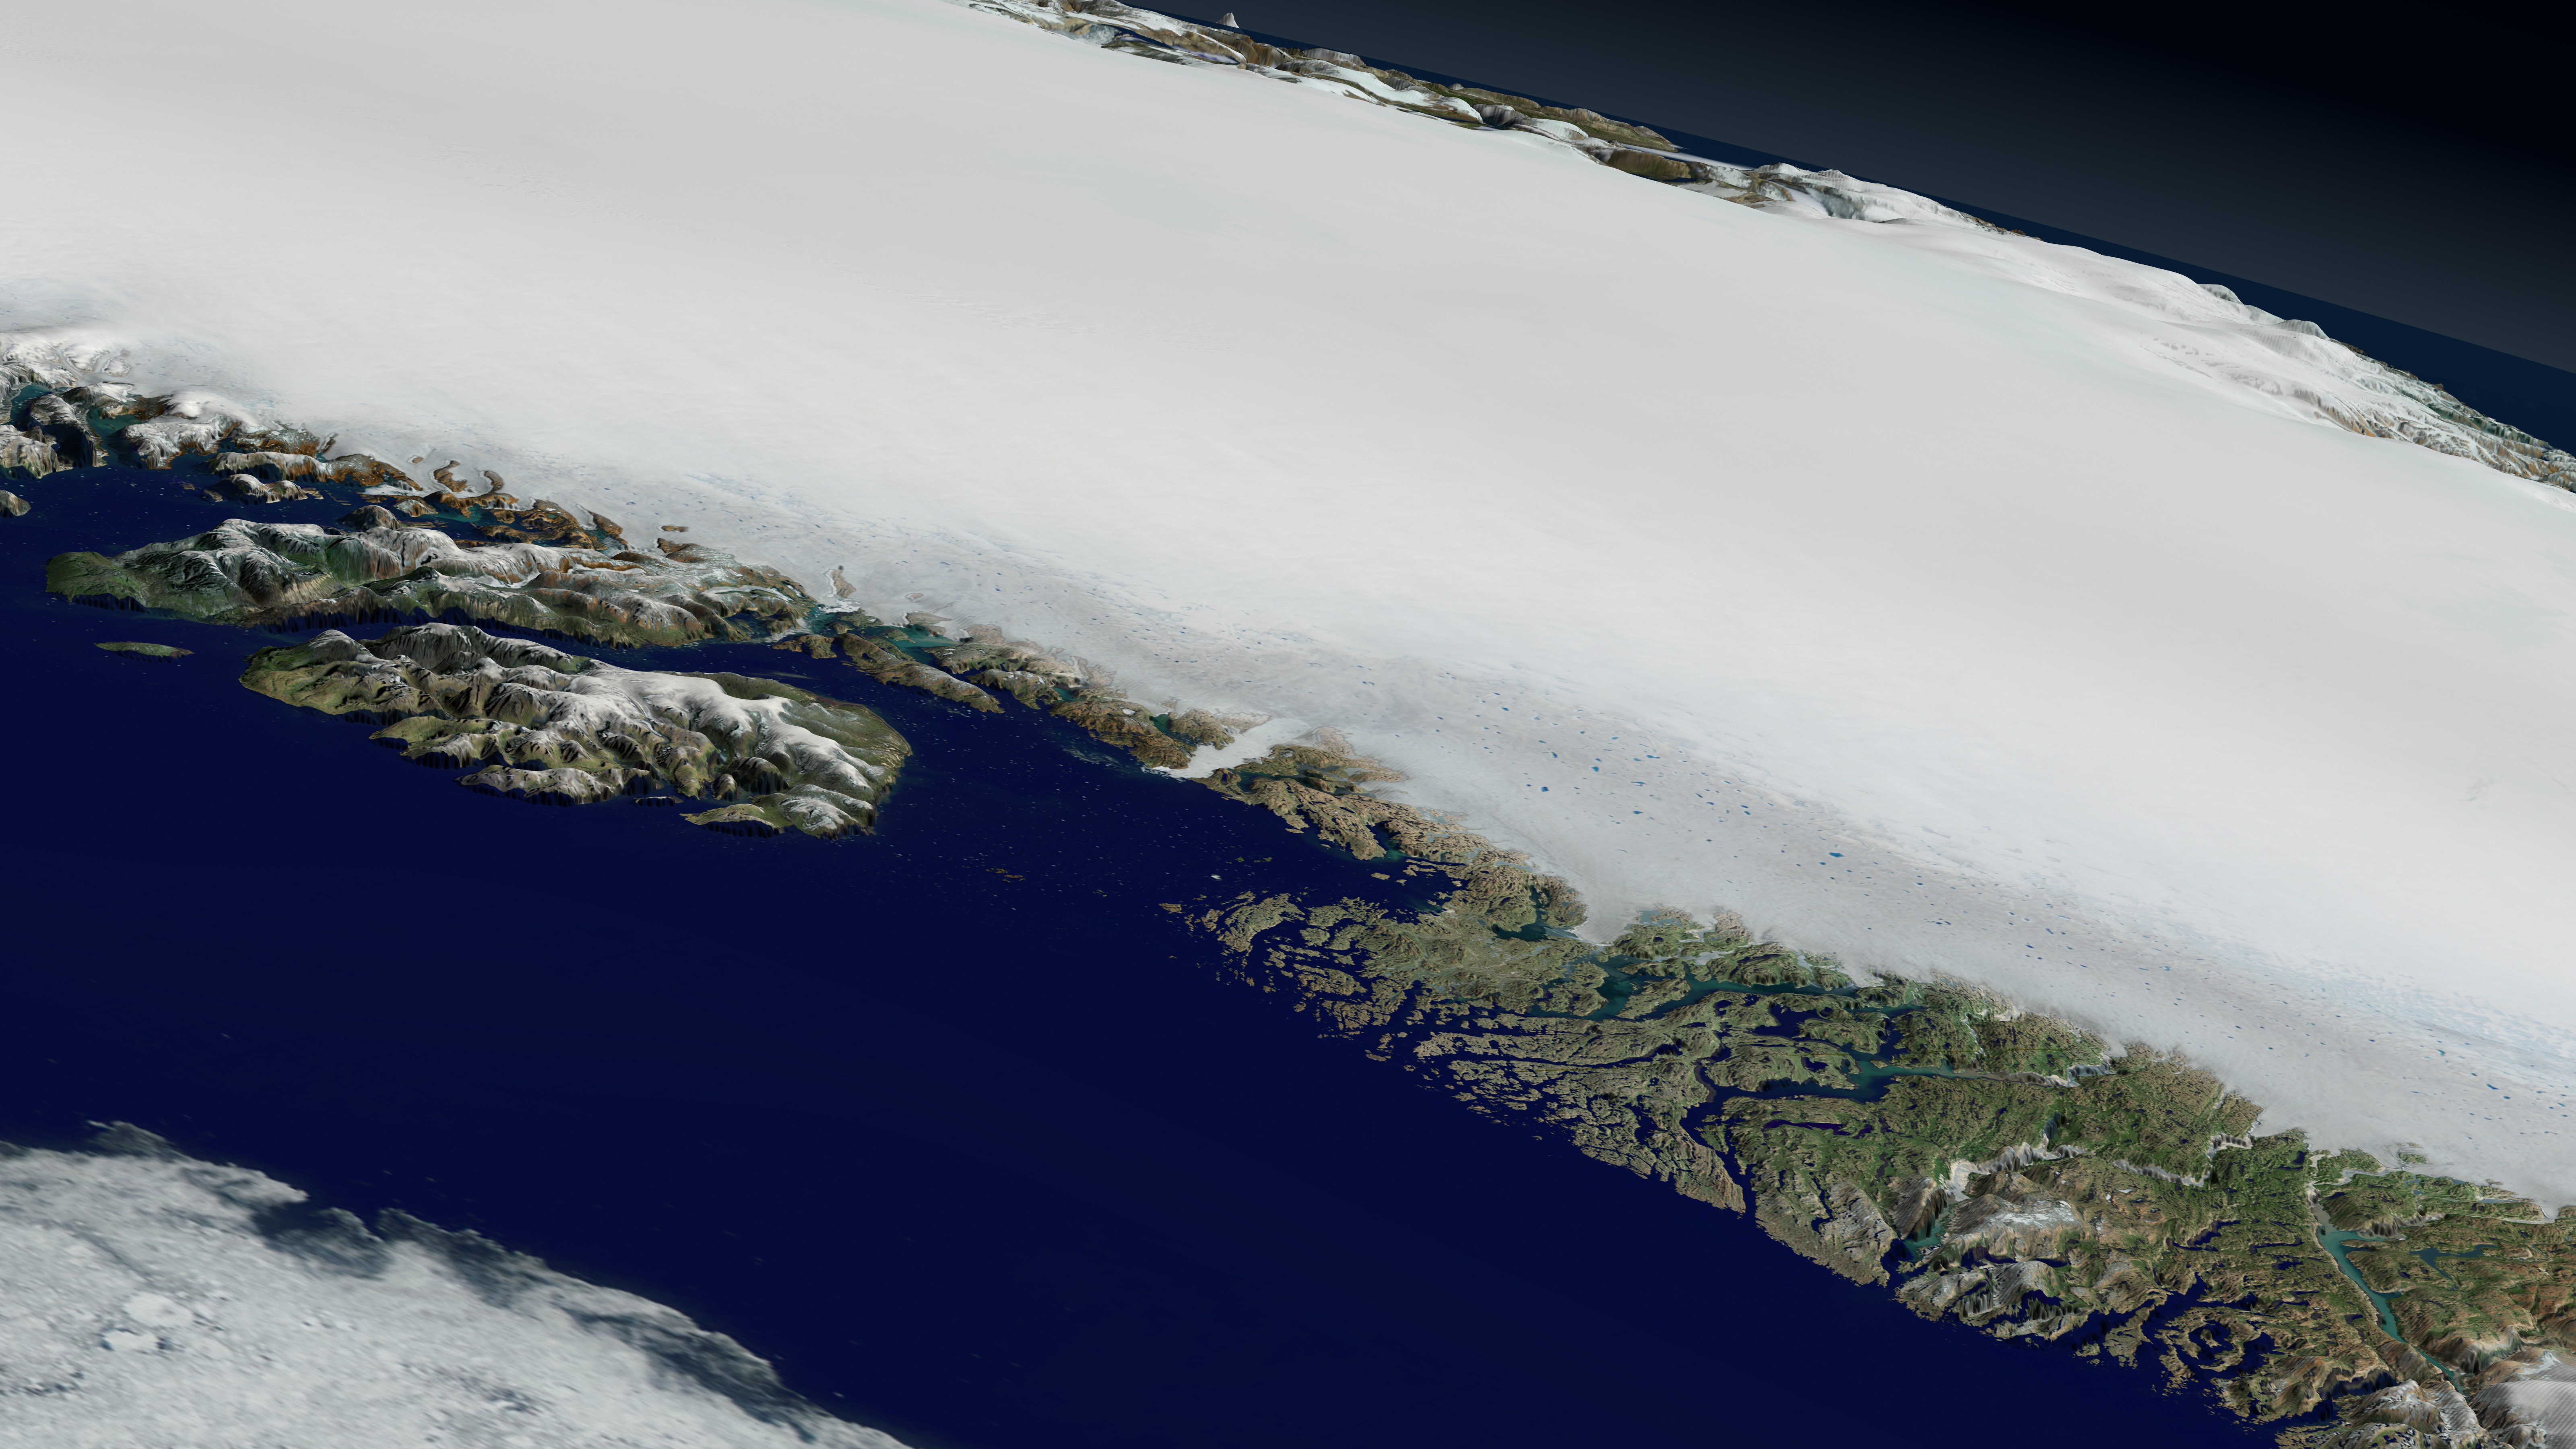
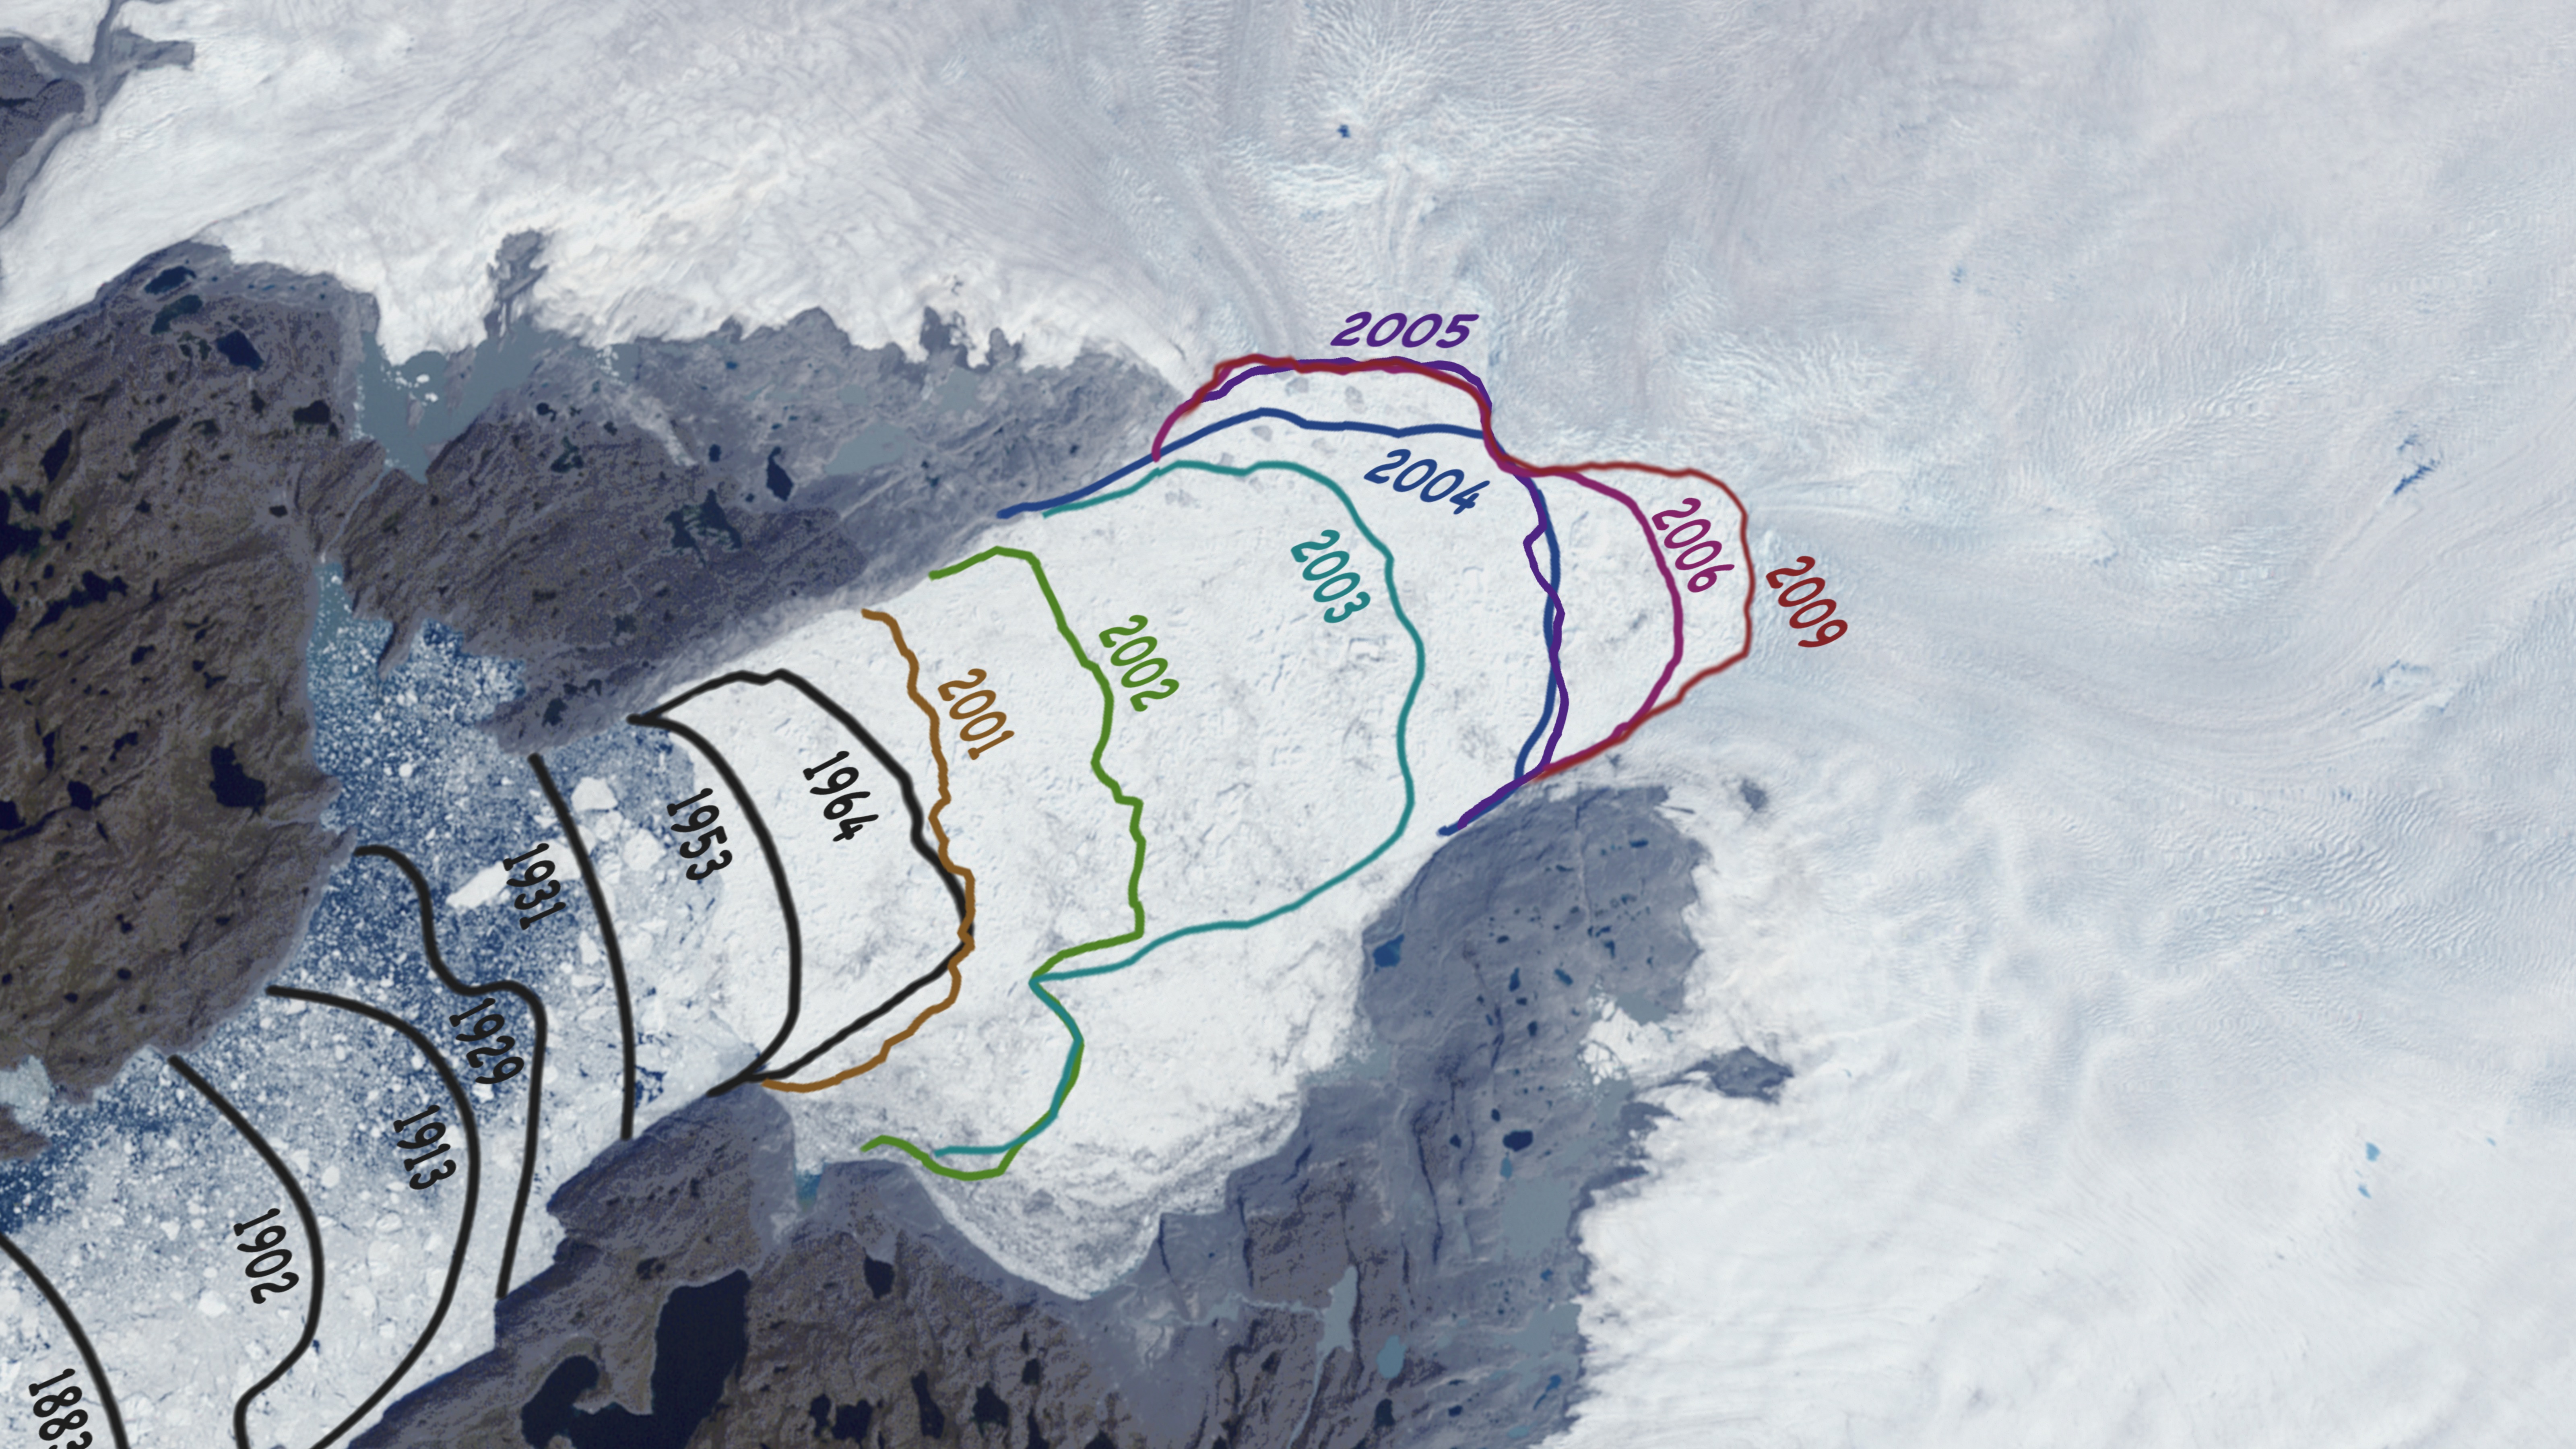
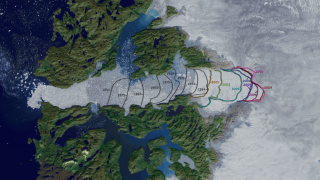
While moving from the Arctic to Greenland, the animation shows the constant motion of the Arctic polar ice using daily measures of sea ice activity. Sea ice flows from the Arctic into Baffin Bay as the seasonal ice expands southward. As we draw close to the Greenland coast, the animation shows the recent changes in the Jakobshavn glacier. Although Jakobshavn receded only slightly from 1964 to 2001, the animation shows significant recession from 2001 through 2009. As the animation pulls out from Jakobshavn, the effect of the increased flow rate of Greenland costal glaciers is shown by the thinning ice shelf regions near the Greenland coast.
This animation shows a wealth of data collected from satellite observations of the cryosphere and the impact that recent cryospheric changes are making on our planet.
For more information on the data sets used in this visualization, visit NASA's EOS DAAC website.
Note: This animation is an update of the animation 'A Short Tour of the Cryosphere', which is itself an abridged version of the animation 'A Tour of the Cryosphere'. The popularity of the earlier animations and their continuing relevance prompted us to update the datasets in parts of the animation and to remake it in high definition. In certain cases, our experiences in using the earlier work have led us to tweak the presentation of some of the material to make it clearer. Our thanks to Dr. Robert Bindschadler for suggesting and supporting this remake.


Related
Visualization Credits
Cindy Starr (Global Science and Technology, Inc.): Lead Visualizer
Horace Mitchell (NASA/GSFC): Animator
Lori Perkins (NASA/GSFC): Animator
Ryan Boller (NASA/GSFC): Animator
Greg Shirah (NASA/GSFC): Animator
Tom Bridgman (Global Science and Technology, Inc.): Animator
Marte Newcombe (GST): Animator
Helen-Nicole Kostis (UMBC): Animator
Eric Sokolowsky (GST): Animator
Randall Jones (GST): Animator
Horace Mitchell (NASA/GSFC): Video Editor
Michael Starobin (HTSI): Narrator
Waleed Abdalati (NASA/GSFC): Scientist
Bob Bindschadler (NASA/GSFC): Scientist
Dorothy Hall (NASA/GSFC): Scientist
Walt Meier (NSIDC): Scientist
Richard Armstrong (University of Colorado): Scientist
Ronald Weaver (University of Colorado): Scientist
Mary Jo Brodzik (University of Colorado): Scientist
James W. Williams (GST): Project Support
Stuart A. Snodgrass (GST): Project Support
Jarrett Cohen (GST): Writer
Michael Starobin (HTSI): Writer
NASA/Goddard Space Flight Center Scientific Visualization Studio The Blue Marble Next Generation data is courtesy of Reto Stockli (NASA/GSFC) and NASA's Earth Observatory. Historic calving front locations courtesy of Anker Weidick and Ole Bennike, Geological Survey of Denmark and Greenland
https://svs.gsfc.nasa.gov/3619
Missions:
Galileo
Global Precipitation Measurement (GPM)
Ice, Cloud, and land Elevation Satellite (ICESat)
Landsat
QuikSCAT
Shuttle Radar Topography Mission - SRTM
Terra
Data Used:
SRTM/SIR-C/DEM
Terra/ASTER/Calving Front Lines
Analysis - 7/2/2005, 8/8/2006Landsat/TM/Calving Front Line
Analysis - 7/7/2001, 9/3/2002, 8/23/2003, 10/3/2004, 7/29/2009Terra and Aqua/MODIS/Band Combination 1, 4, 3 also referred to as: True Color
NASA - 1/31/2002, 2/17/2002, 2/23/2002, 3/5/2002, 3/7/2002, 12/18/2002, 11/9/2004, 11/15/2004, 11/19/2004, 11/21/2004, 11/26/2004, 12/2/2004, 12/4/2004, 12/7/2004, 12/10/2004, 12/13/2004, 12/20/2004, 12/23/2004, 1/2/2005, 1/11/2005, 1/12/2005, 1/14/2005, 1/17/2005, 1/18/2005, 1/21/2005, 1/26/2005, 1/29/2005, 1/30/2005, 3/2/2009, 7/10/2009Terra and Aqua/MODIS/Normalized Difference Vegetation Index (NDVI) also referred to as: NDVI
NASA - 5/19/2002, 2/15/2003-5/19/2003Radarsat Antarctic Mapping Project (RAMP) Digital Elevation Model (DEM) also referred to as: RAMP DEM
Data Compilation - NSIDCAqua/AMSR-E/Level 3 12.5 km Sea Ice Concentration also referred to as: Sea Ice Concentration
3/22/2007-6/23/2009Landsat-7/ETM+/Landsat Image Mosaic of Antarctica also referred to as: LIMA
Mosaic - NASA/GSFC, British Antarctic Survey, USGS EROS Data Center - 1999-2003Terra/ASTER/Band Combination 3, 2, 1
8/8/2006Terra and Aqua/MODIS/Blue Marble: Next Generation also referred to as: BMNG
1/1/2004 - 12/31/2004The Blue Marble data is courtesy of Reto Stockli (NASA/GSFC).
Terra/MODIS/Snow Cover Daily L3 Global 0.05Deg CMG (MOD10C1)
5/19/2002, 12/21/2002-5/19/2003,3/22/2007-9/10/2007,1/10/2009-4/6/2009GOES-8/Imager
12/22/2002-1/2/2003RADARSAT-1/SAR/Derived Velocities
2000Additional credit goes to Canadian Space Agency, RADARSAT International Inc.
ICESat/GLAS/L1B Global Elevation Data (GLA06)
2003-2006World Glacier Inventory
Data Compilation - NSIDCNSIDC SSMI-derived September Minimum Sea Ice Concentration
Data Compilation - NSIDC - 1979-2008Circum-Arctic Map of Permafrost and Ground-Ice Conditions
Data Compilation - NSIDCGTOPO30 Topography and Bathymetry
Data Compilation - USGSGridded Population of the World (Version 3 Beta)
Data Compilation - SEDACTerra/MISR
9/16/2000, 11/28/2000, 12/12/2000, 1/1/2001, 1/22/2001, 2/25/2001, 9/8/2001, 10/10/2001, 10/26/2001, 11/4/2001, 11/9/2001, 11/11/2001, 11/12/2001QuikSCAT/SeaWinds
3/1/2004-2/10/2004This item is part of these series:
Narrated Movies
Goddard Shorts
Keywords:
DLESE >> Cryology
SVS >> HDTV
SVS >> Snow and Ice
GCMD >> Earth Science >> Atmosphere >> Precipitation >> Snow
GCMD >> Earth Science >> Cryosphere >> Frozen Ground >> Permafrost
GCMD >> Earth Science >> Cryosphere >> Glaciers/Ice Sheets >> Glacier Motion/Ice Sheet Motion
GCMD >> Earth Science >> Cryosphere >> Glaciers/Ice Sheets >> Glacier Thickness/Ice Sheet Thickness
GCMD >> Earth Science >> Cryosphere >> Glaciers/Ice Sheets >> Glacier Topography/Ice Sheet Topography
GCMD >> Earth Science >> Cryosphere >> Glaciers/Ice Sheets >> Glaciers
GCMD >> Earth Science >> Cryosphere >> Glaciers/Ice Sheets >> Ice Sheets
GCMD >> Earth Science >> Cryosphere >> Sea Ice >> Ice Growth/Melt
GCMD >> Earth Science >> Cryosphere >> Sea Ice >> Sea Ice Concentration
GCMD >> Earth Science >> Cryosphere >> Sea Ice >> Sea Ice Motion
GCMD >> Earth Science >> Cryosphere >> Snow/Ice >> Ice Extent
GCMD >> Earth Science >> Cryosphere >> Snow/Ice >> Ice Growth/Melt
GCMD >> Earth Science >> Cryosphere >> Snow/Ice >> Ice Motion
GCMD >> Earth Science >> Cryosphere >> Snow/Ice >> Ice Velocity
GCMD >> Earth Science >> Cryosphere >> Snow/Ice >> Permafrost
GCMD >> Earth Science >> Cryosphere >> Snow/Ice >> Snow Cover
GCMD >> Earth Science >> Hydrosphere >> Glaciers/Ice Sheets >> Glacier Motion/Ice Sheet Motion
GCMD >> Earth Science >> Hydrosphere >> Glaciers/Ice Sheets >> Glacier Topography/Ice Sheet Topography
GCMD >> Earth Science >> Hydrosphere >> Glaciers/Ice Sheets >> Glaciers
GCMD >> Earth Science >> Hydrosphere >> Glaciers/Ice Sheets >> Ice Sheets
GCMD >> Earth Science >> Hydrosphere >> Snow/Ice >> Ice Growth/Melt
GCMD >> Earth Science >> Hydrosphere >> Snow/Ice >> Ice Motion
GCMD >> Earth Science >> Hydrosphere >> Snow/Ice >> Ice Velocity
GCMD >> Earth Science >> Hydrosphere >> Snow/Ice >> Permafrost
GCMD >> Earth Science >> Hydrosphere >> Snow/Ice >> Snow Cover
SVS >> Hyperwall
SVS >> Edited Feature
SVS >> GOES
SVS >> Copenhagen
DLESE >> Narrated
SVS >> Voice Over Talent
NASA Science >> Earth
GCMD keywords can be found on the Internet with the following citation: Olsen, L.M., G. Major, K. Shein, J. Scialdone, S. Ritz, T. Stevens, M. Morahan, A. Aleman, R. Vogel, S. Leicester, H. Weir, M. Meaux, S. Grebas, C.Solomon, M. Holland, T. Northcutt, R. A. Restrepo, R. Bilodeau, 2013. NASA/Global Change Master Directory (GCMD) Earth Science Keywords. Version 8.0.0.0.0


