Earth
ID: 3598
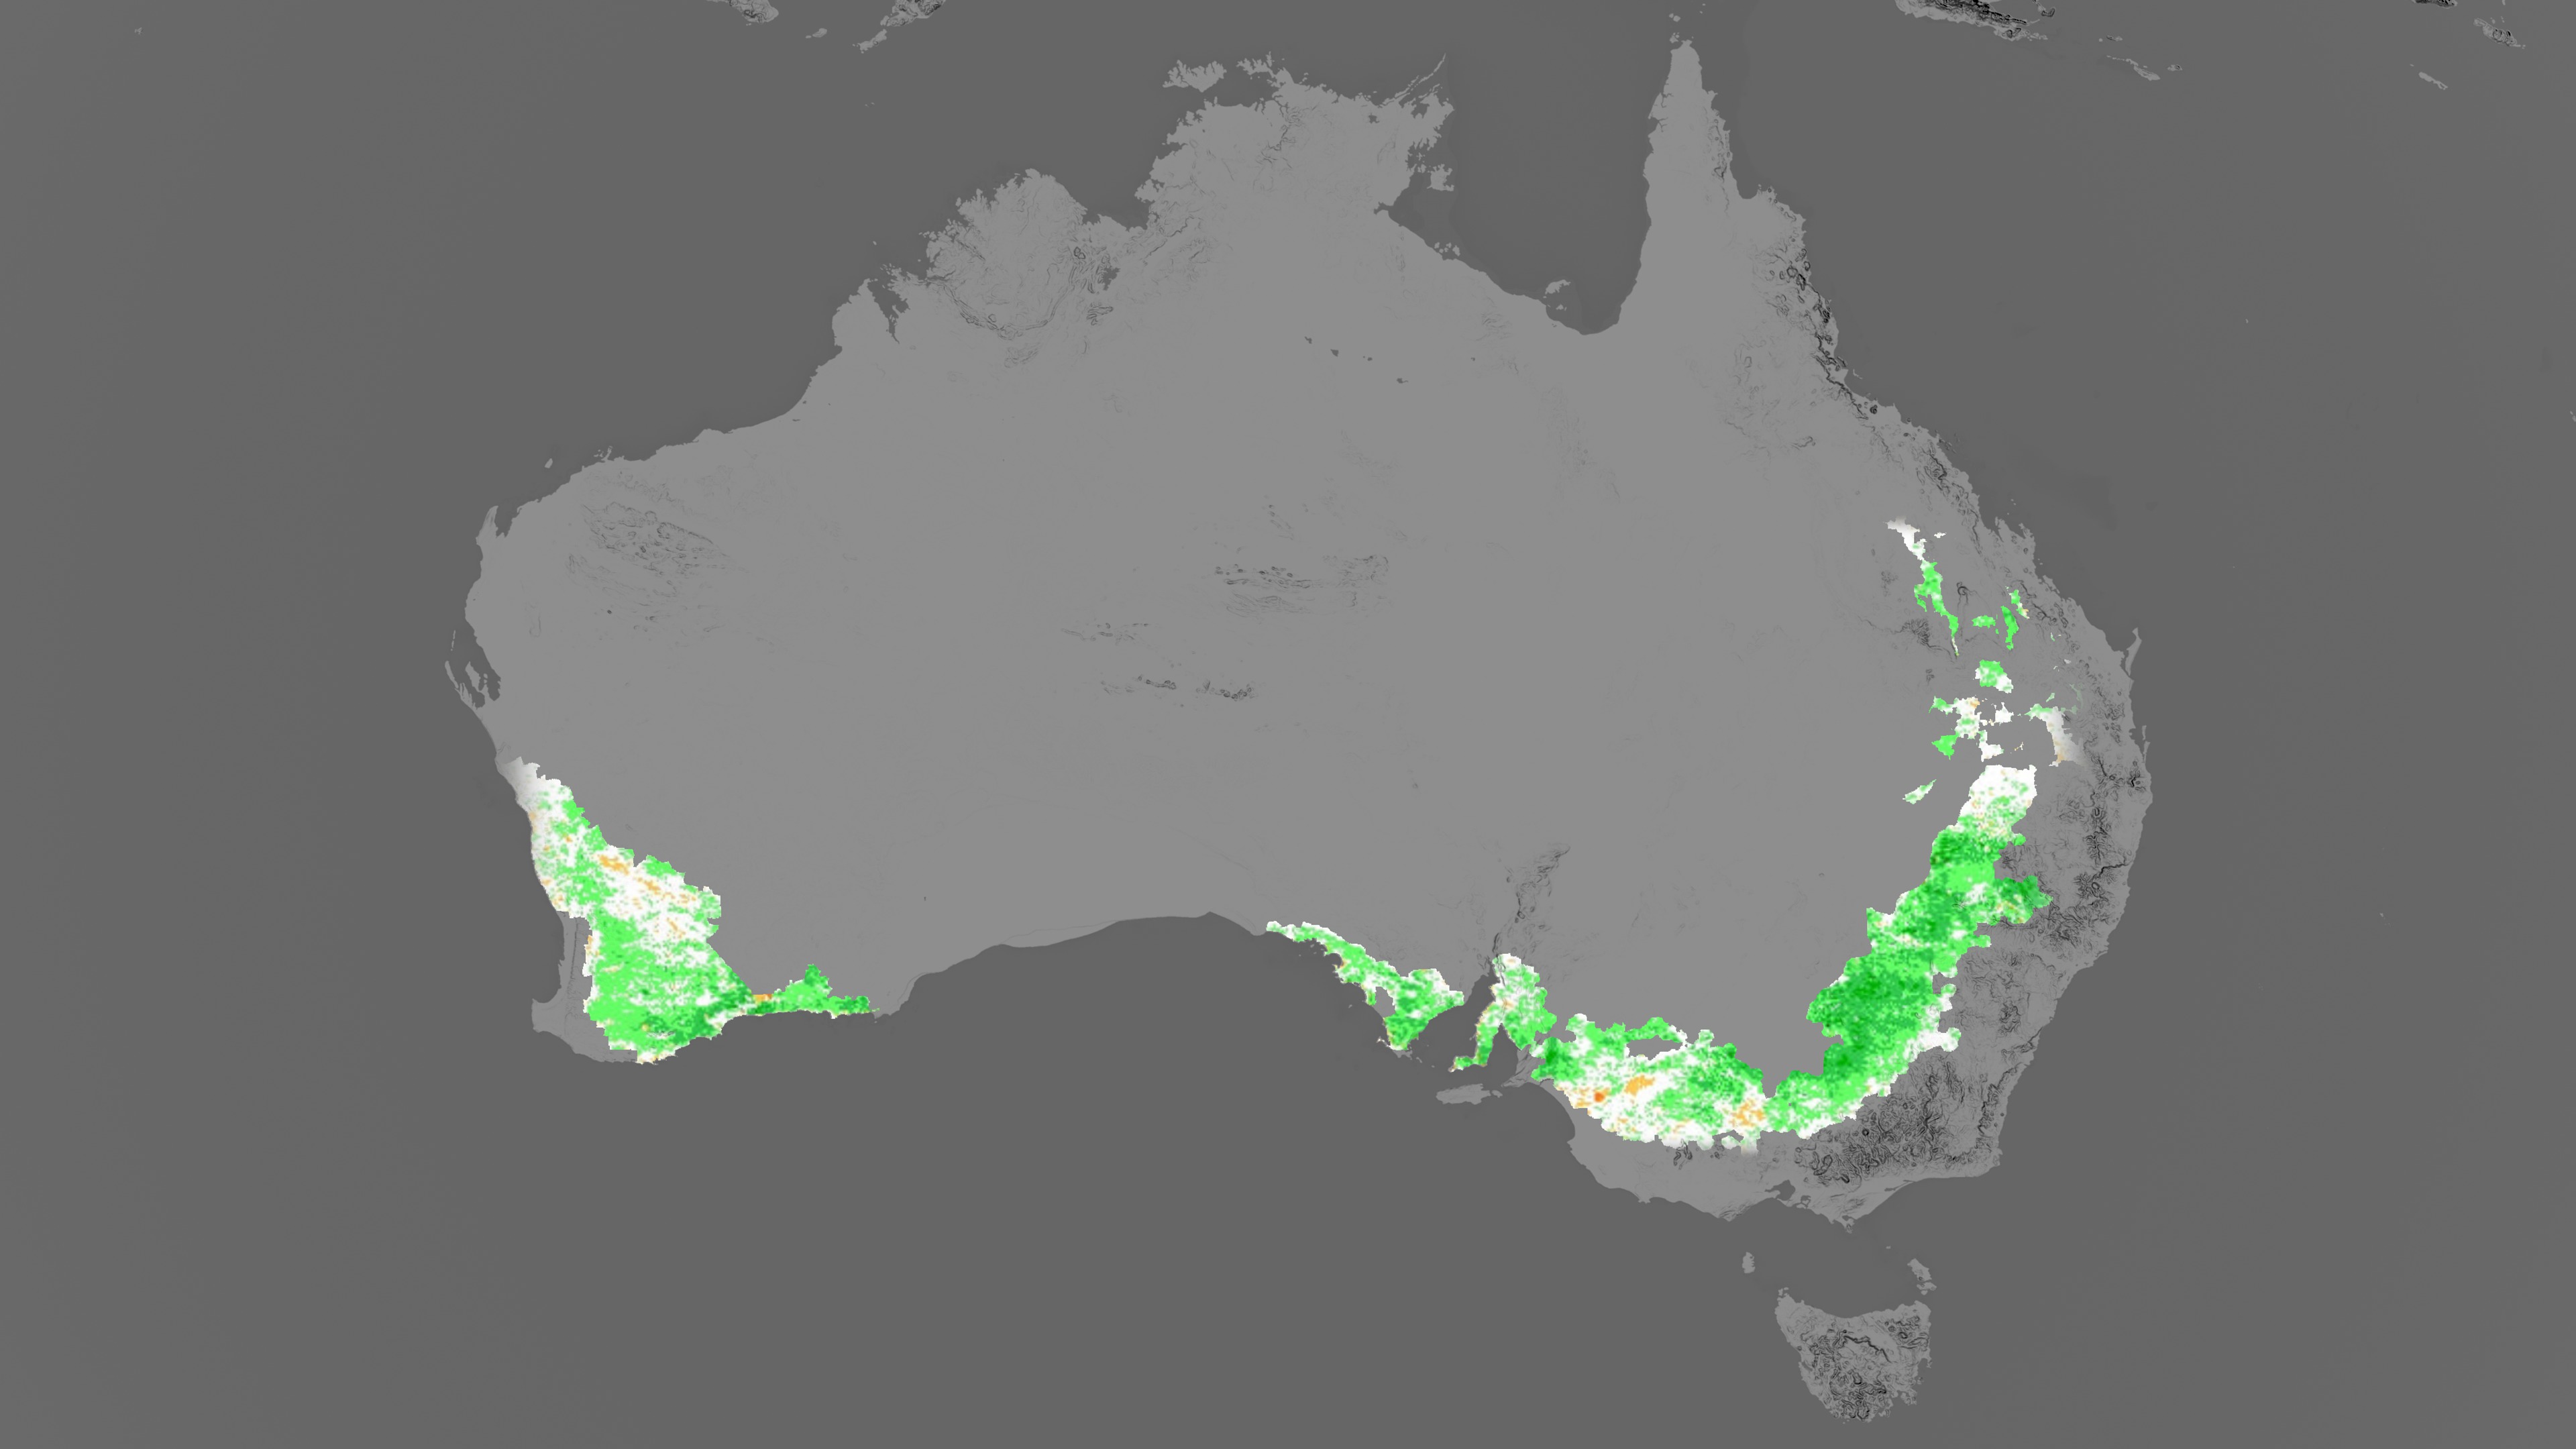
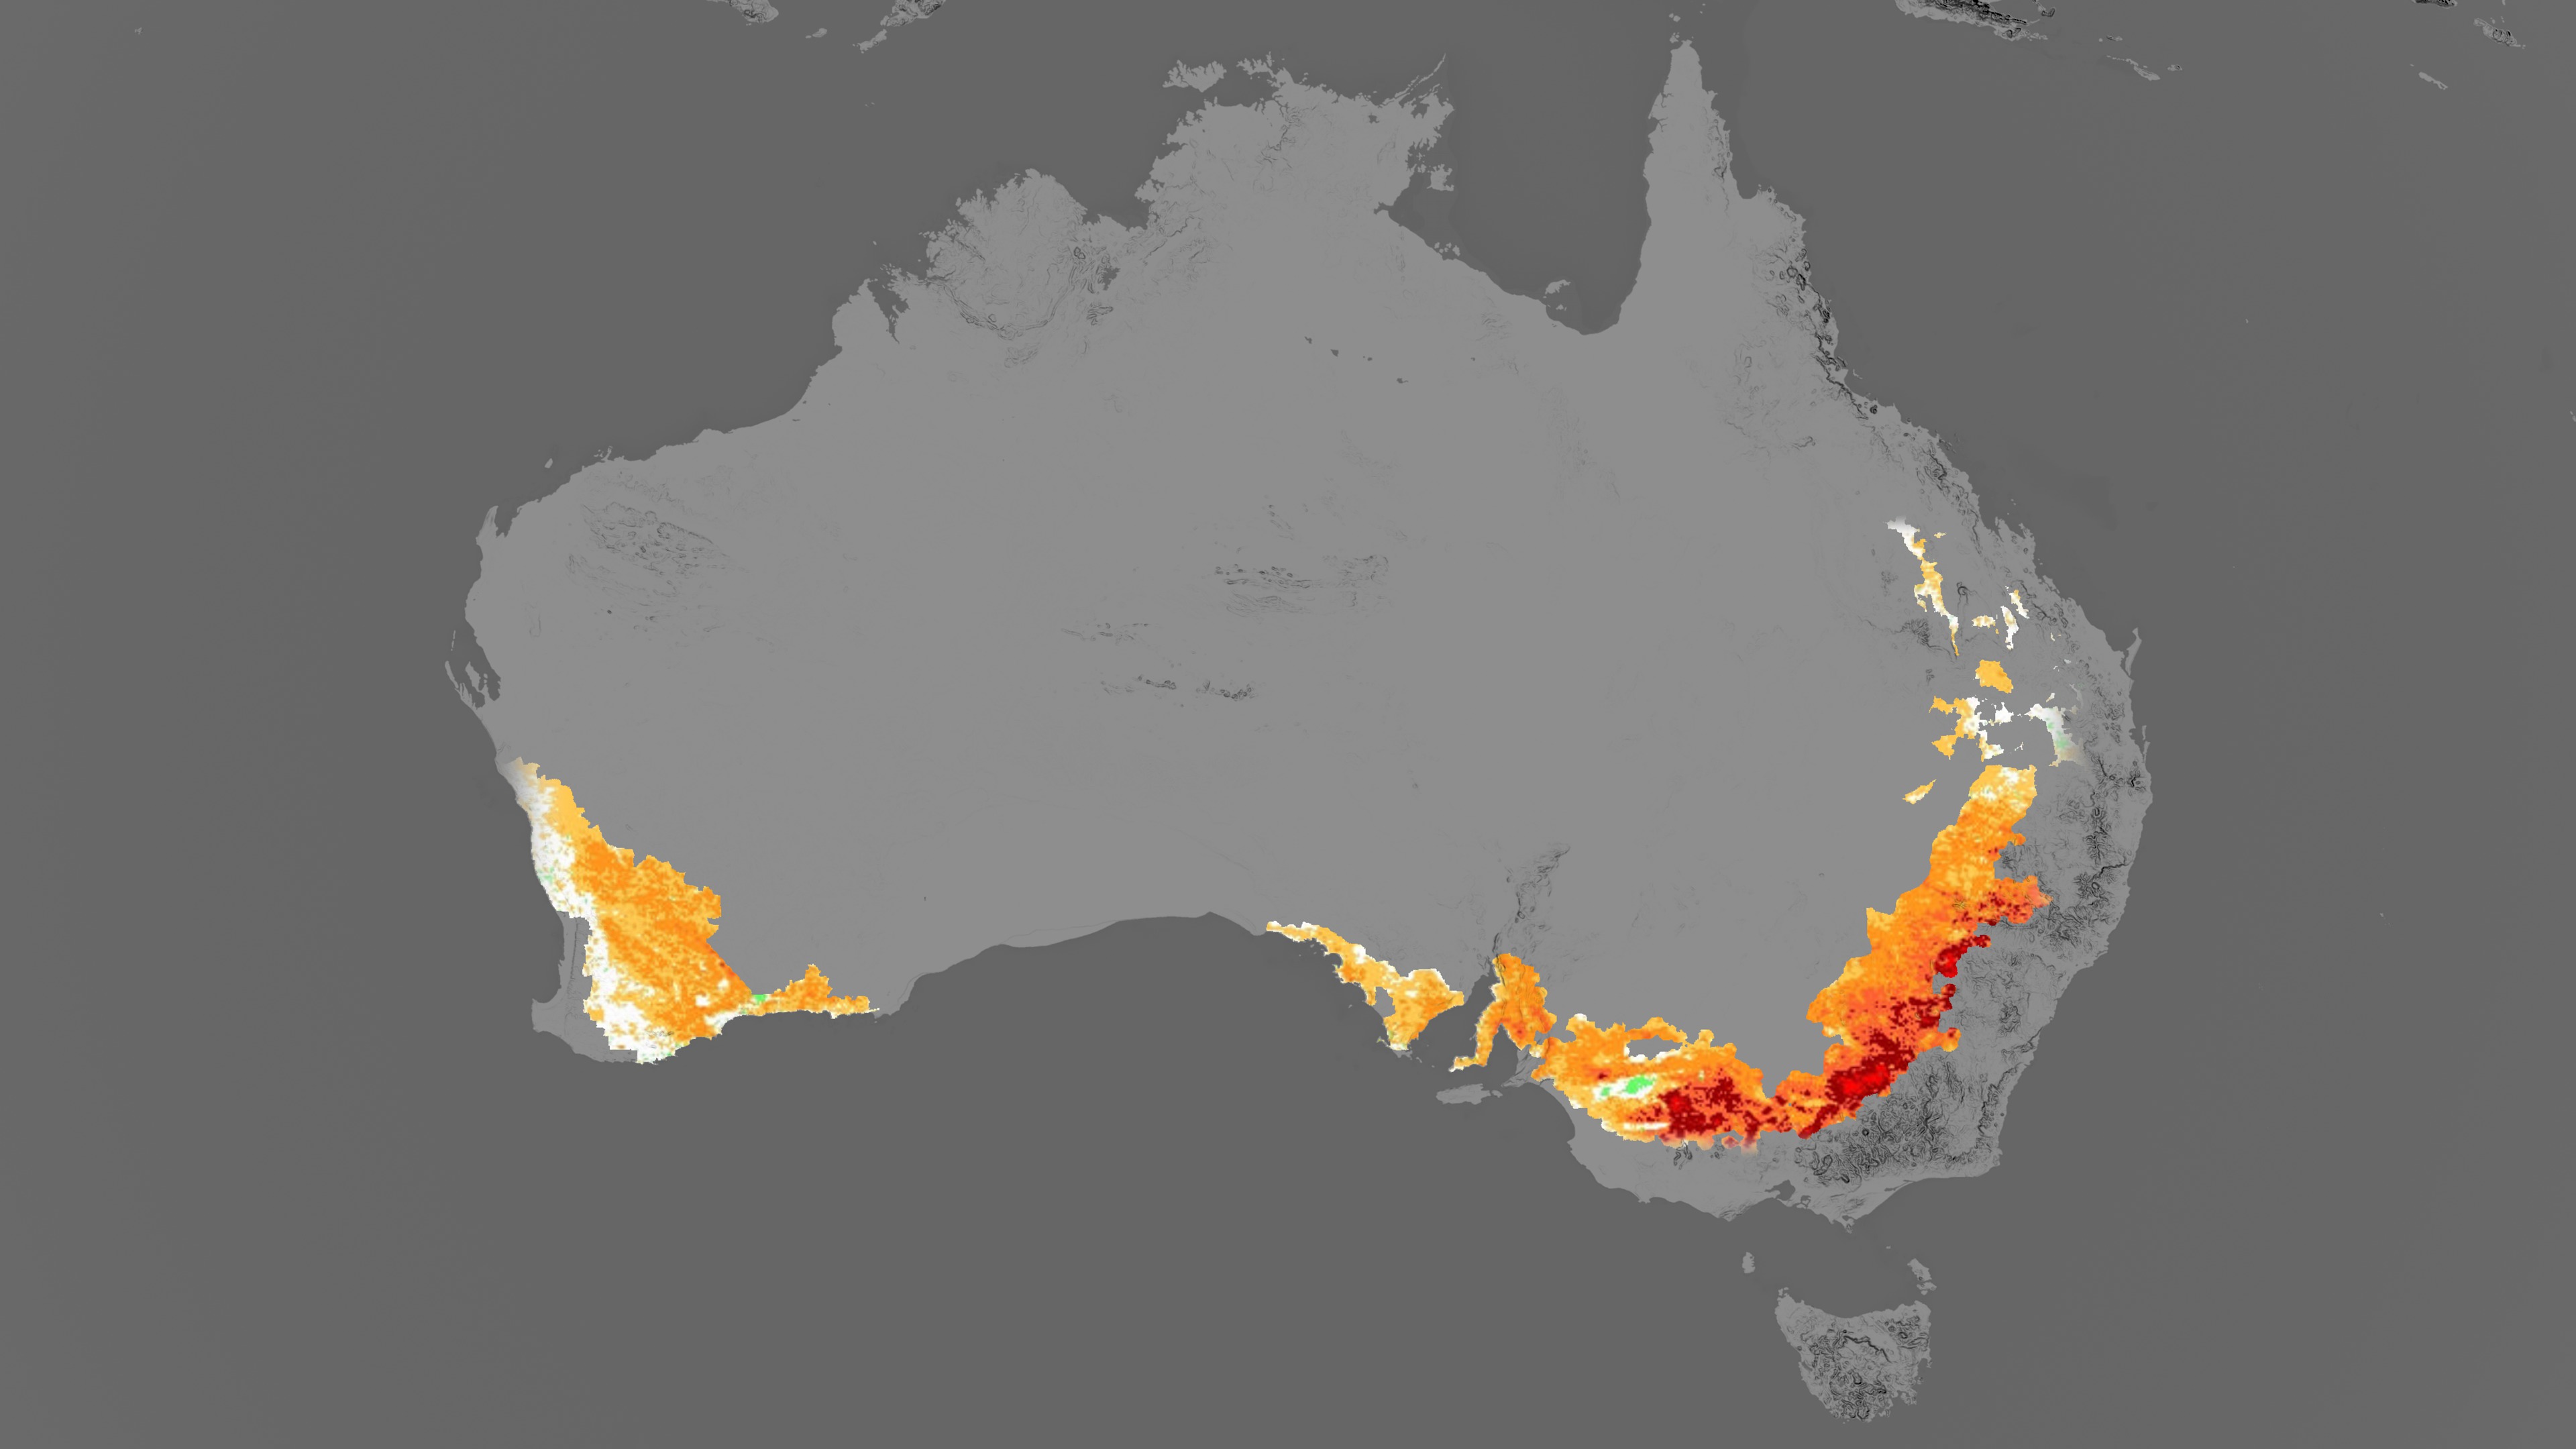
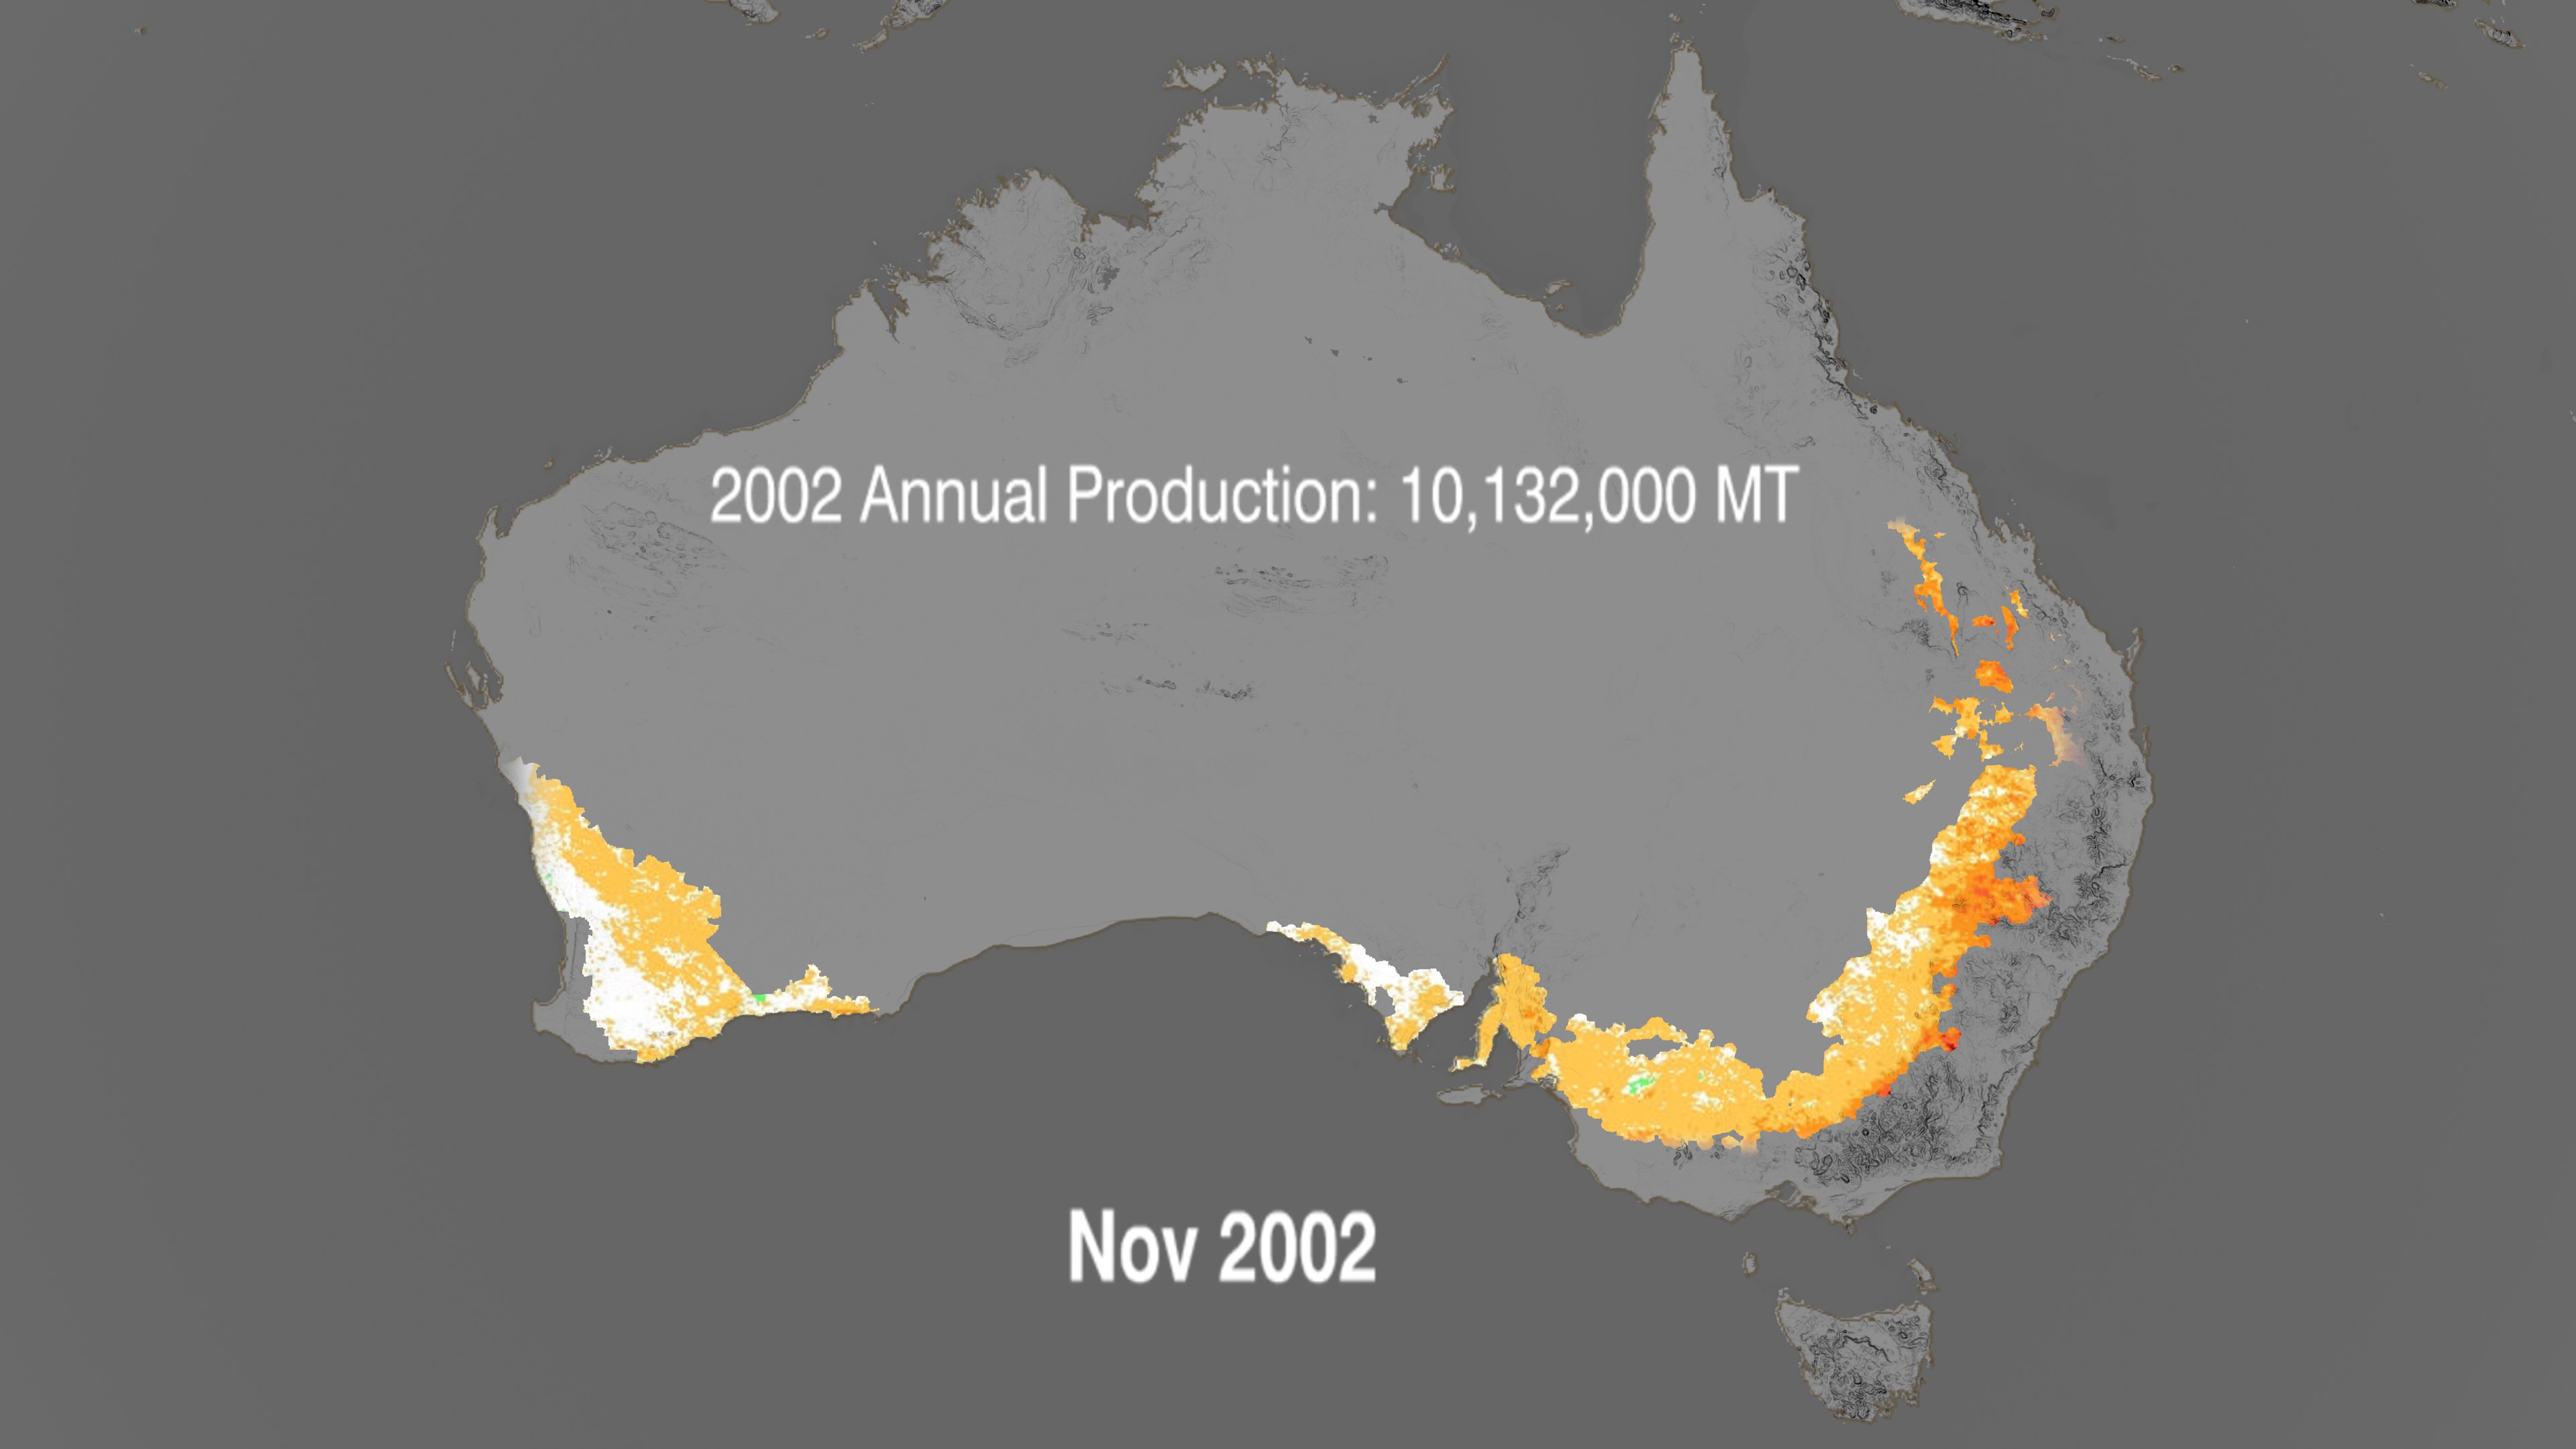
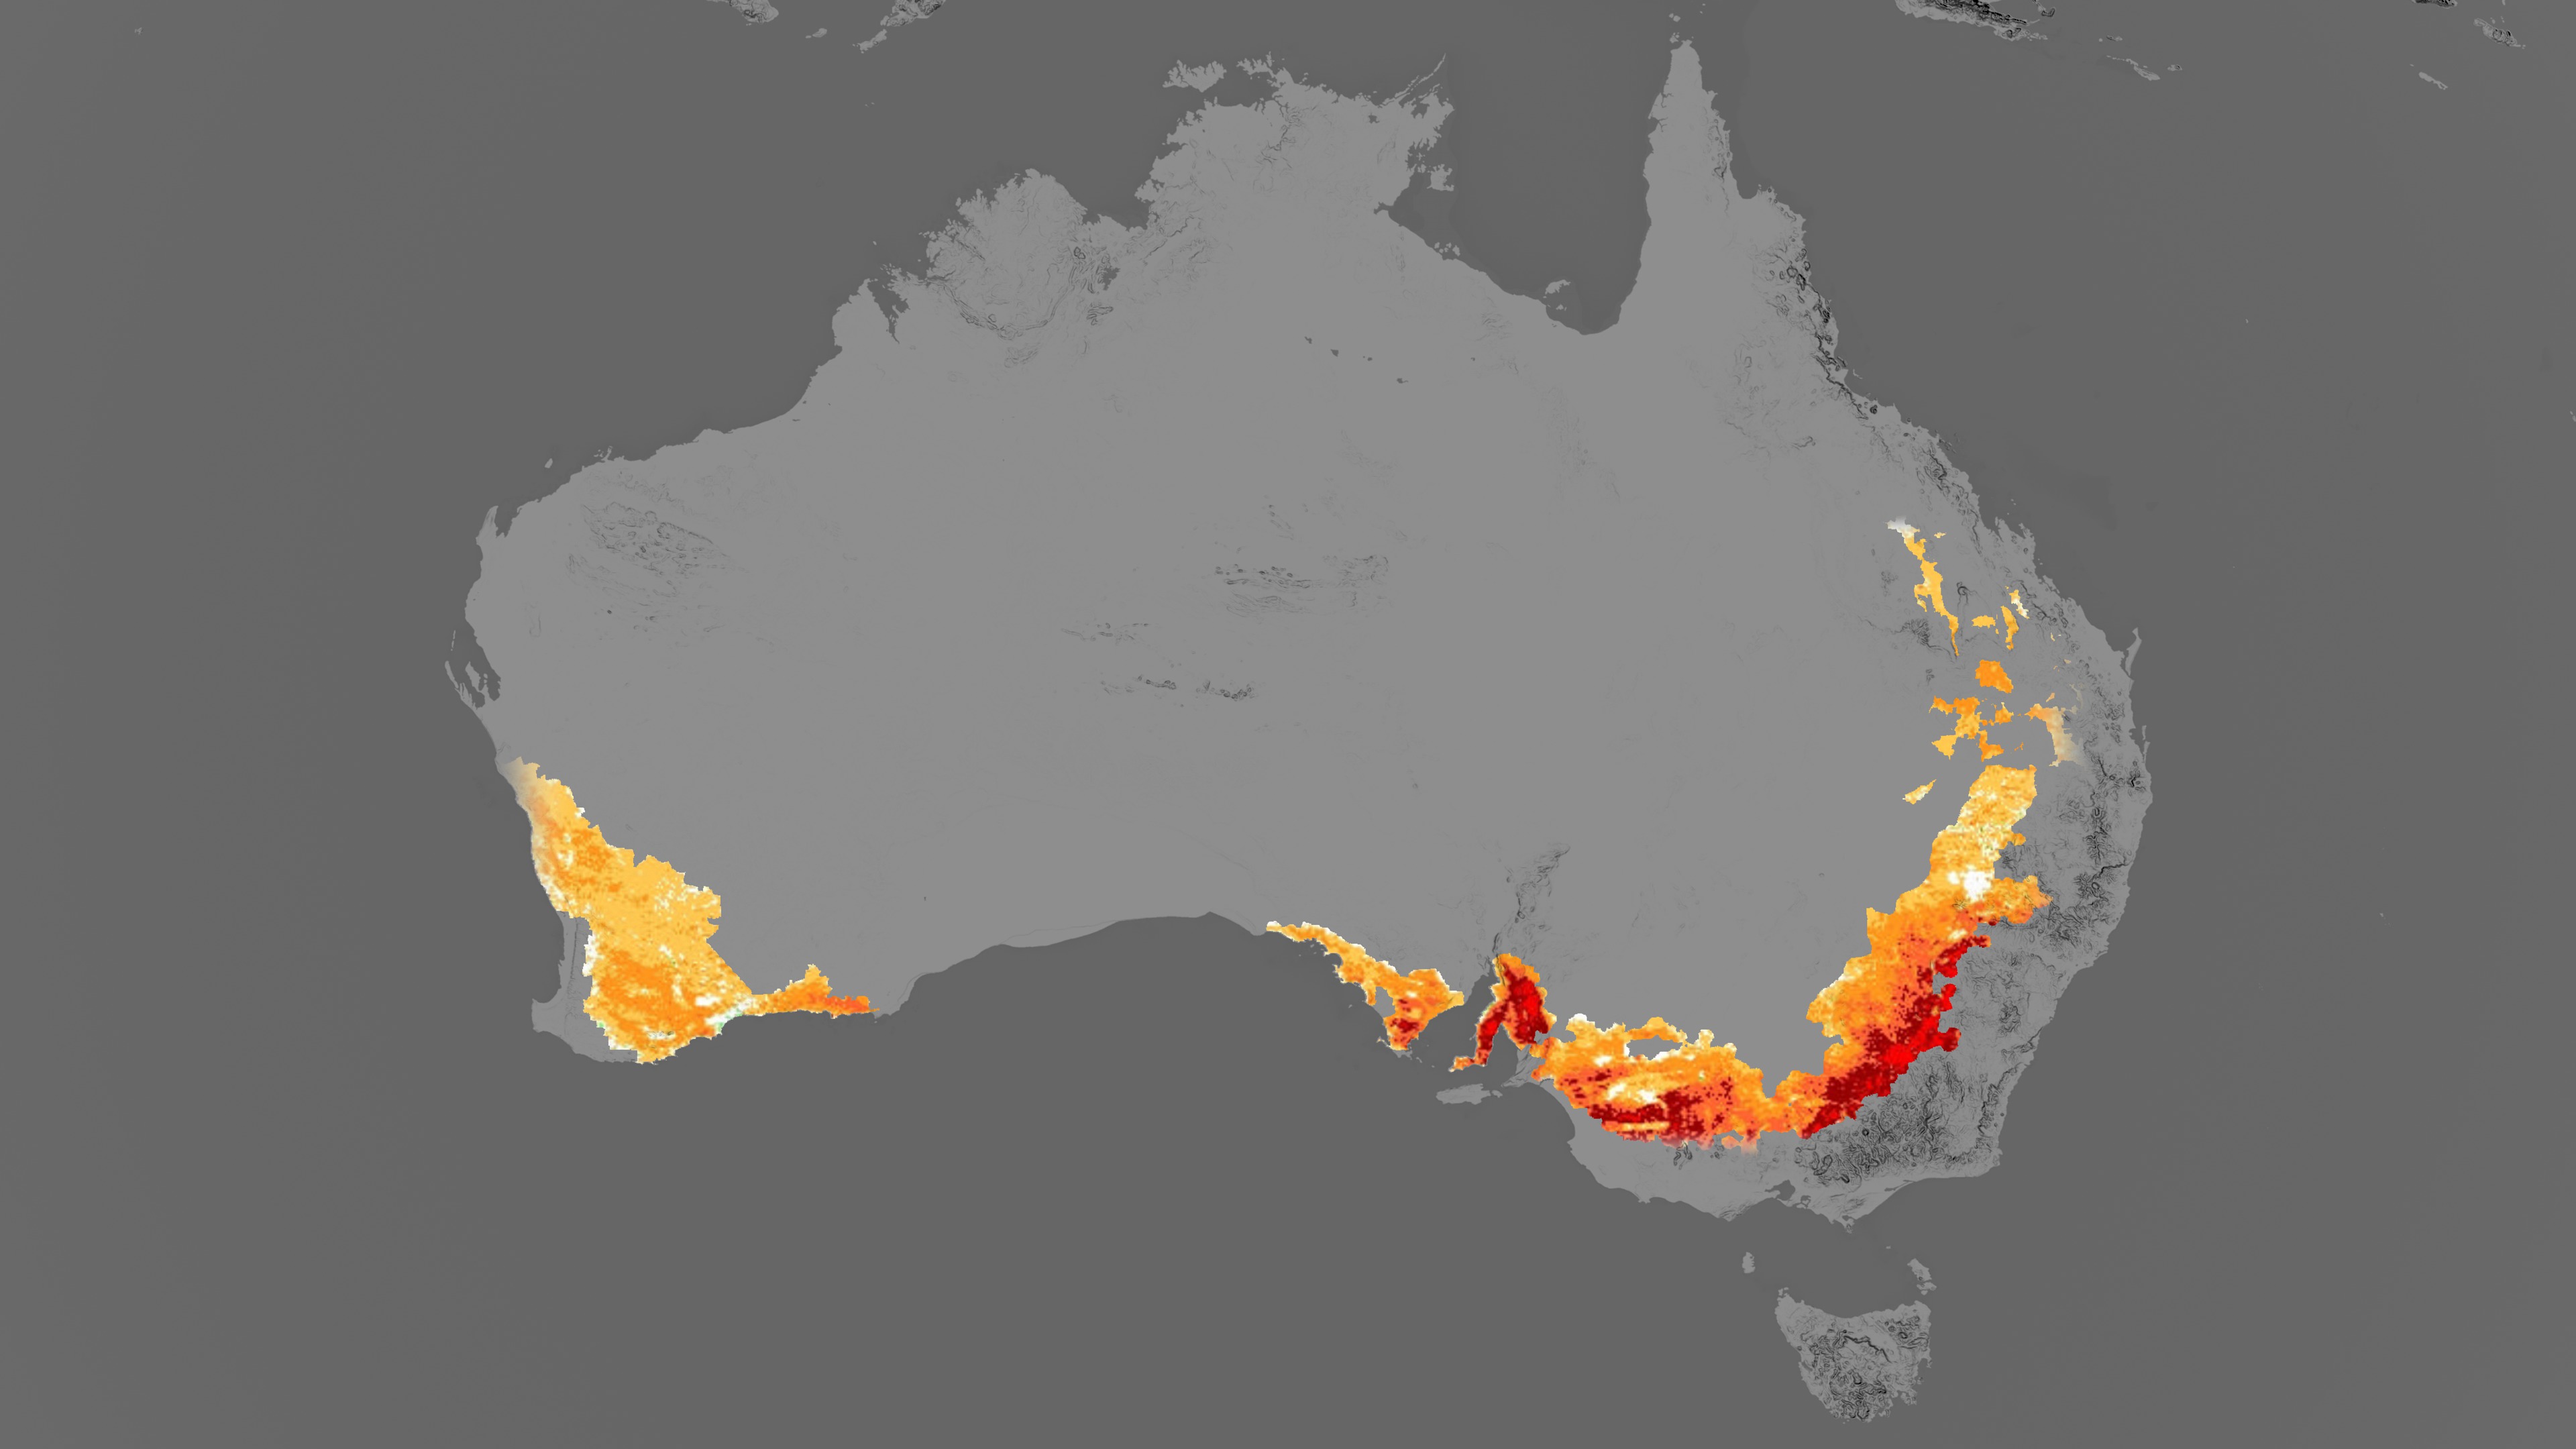
Normalized Difference Vegetation Index (NDVI) maps allow comparisons of the spatial and temporal variability in the amount and condition of vegetation. The time series satellite derived NDVI was used to monitor and analyze changes in vegetation patterns in the major wheat production domain area in Australia. The NDVI comparison was done during the growing season, April through November, for 2002, 2005, and 2006 and it found that significant differences in vegetation growth production. These data and utilities are fundamental for crop yield forecasts and can serve as an early warning system for regions suffering from crop loss and food shortages. Wheat is Australia's most important crop, with a seasonal gross value approaching 3 billion Australian dollars. Australia contributes between and 8 and 15% of world's wheat trade, making it the fourth largest exporter after the United States, Canada and the European Union. Severe drought in Australia not only decimating crops, but it also curtails exports and causes major price and trade impacts on global markets. In 2006, wheat exports dropped by a third from the year before which caused worldwide prices to soar to the highest levels in a decade.


Monitoring Agricultural Production from Space
Visualization Credits
Lori Perkins (NASA/GSFC): Lead Animator
Cindy Starr (Global Science and Technology, Inc.): Visualizer
Chris Justice (University of Maryland): Scientist
Inbal Becker Reshef (University of Maryland): Scientist
Cindy Starr (Global Science and Technology, Inc.): Visualizer
Chris Justice (University of Maryland): Scientist
Inbal Becker Reshef (University of Maryland): Scientist
Please give credit for this item to:
NASA/Goddard Space Flight Center
NASA/Goddard Space Flight Center
Short URL to share this page:
https://svs.gsfc.nasa.gov/3598
Mission:
Terra
Data Used:
Note: While we identify the data sets used in these visualizations, we do not store any further details nor the data sets themselves on our site.
This item is part of these series:
NASA and Agriculture - Animations
Agriculture Animations - Global Agricultural Monitoring
Keywords:
DLESE >> Atmospheric science
SVS >> Biscuit
DLESE >> Forestry
SVS >> HDTV
DLESE >> Natural hazards
GCMD >> Earth Science >> Agriculture
GCMD >> Earth Science >> Biosphere >> Ecological Dynamics >> Fire Occurrence
GCMD >> Location >> Australia
SVS >> Copenhagen
SVS >> For Educators
SVS >> Wheat Production
SVS >> Drought Effect
SVS >> Growing Season
NASA Science >> Earth
GCMD keywords can be found on the Internet with the following citation: Olsen, L.M., G. Major, K. Shein, J. Scialdone, S. Ritz, T. Stevens, M. Morahan, A. Aleman, R. Vogel, S. Leicester, H. Weir, M. Meaux, S. Grebas, C.Solomon, M. Holland, T. Northcutt, R. A. Restrepo, R. Bilodeau, 2013. NASA/Global Change Master Directory (GCMD) Earth Science Keywords. Version 8.0.0.0.0
https://svs.gsfc.nasa.gov/3598
Mission:
Terra
Data Used:
Terra and Aqua/MODIS/Normalized Difference Vegetation Index (NDVI) also referred to as: NDVI
NASAThis item is part of these series:
NASA and Agriculture - Animations
Agriculture Animations - Global Agricultural Monitoring
Keywords:
DLESE >> Atmospheric science
SVS >> Biscuit
DLESE >> Forestry
SVS >> HDTV
DLESE >> Natural hazards
GCMD >> Earth Science >> Agriculture
GCMD >> Earth Science >> Biosphere >> Ecological Dynamics >> Fire Occurrence
GCMD >> Location >> Australia
SVS >> Copenhagen
SVS >> For Educators
SVS >> Wheat Production
SVS >> Drought Effect
SVS >> Growing Season
NASA Science >> Earth
GCMD keywords can be found on the Internet with the following citation: Olsen, L.M., G. Major, K. Shein, J. Scialdone, S. Ritz, T. Stevens, M. Morahan, A. Aleman, R. Vogel, S. Leicester, H. Weir, M. Meaux, S. Grebas, C.Solomon, M. Holland, T. Northcutt, R. A. Restrepo, R. Bilodeau, 2013. NASA/Global Change Master Directory (GCMD) Earth Science Keywords. Version 8.0.0.0.0


