Earth
ID: 3584
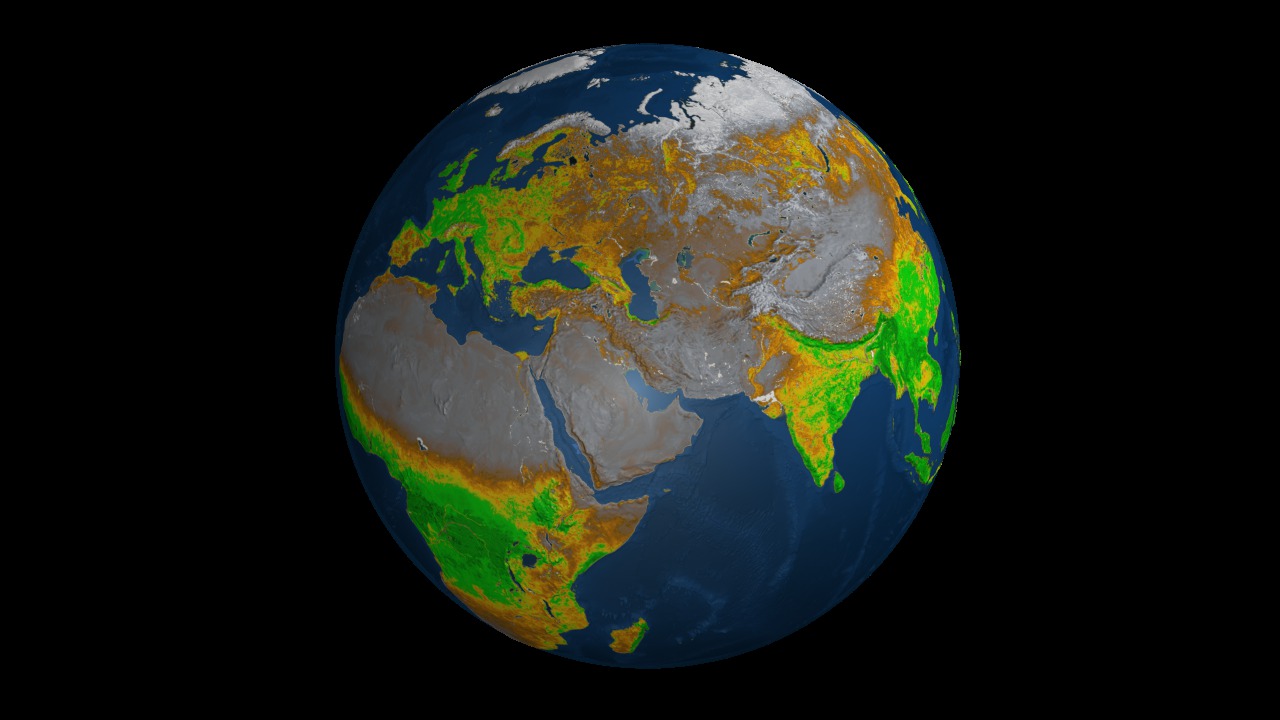
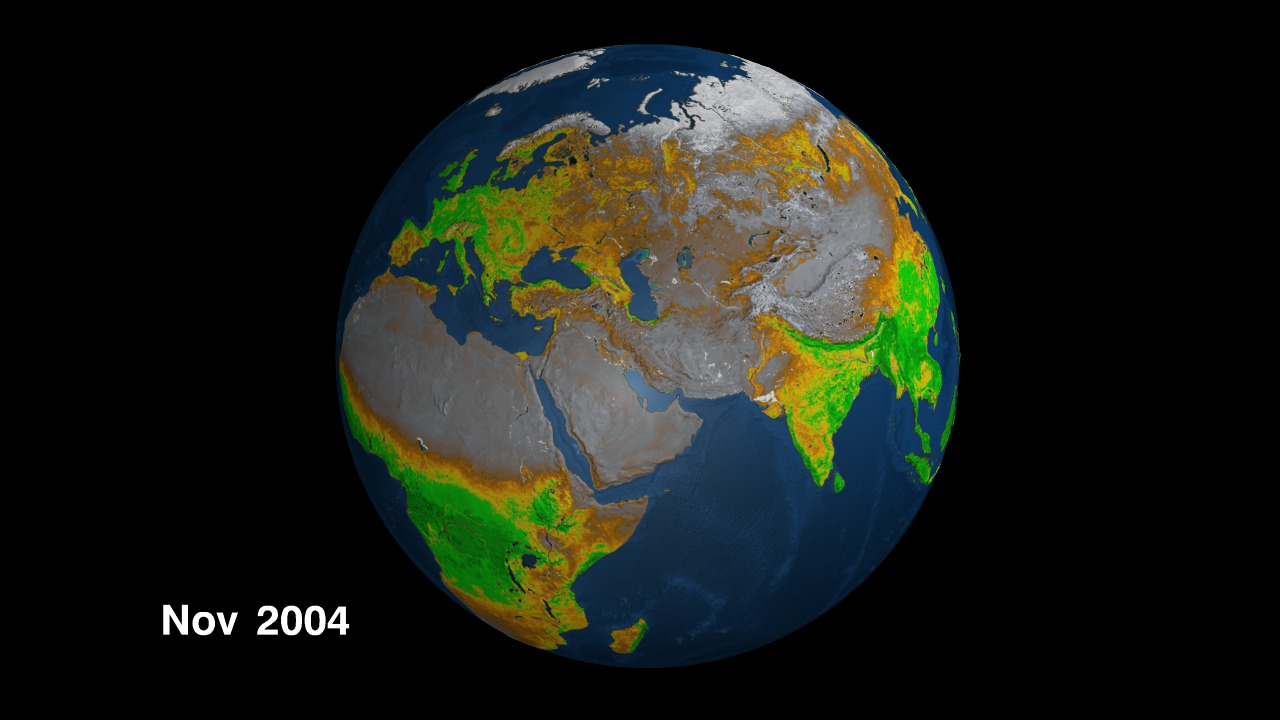
Satellite data can be used to monitor the health of plant life from space. The Normalized Difference Vegetation Index (NDVI) provides a simple numerical indicator of the health of vegetation which can be used to monitoring changes in vegetation over time. This animation shows the seasonal changes in vegetation by fading between average monthly NDVI data from 2004. The loop begins on September 24 and repeats six times during one full rotation of the globe at a rate of one frame per day. The fade for each month is complete on the 15th of each month.

A Global View of Seasonal NDVI
Visualization Credits
Please give credit for this item to:
NASA/Goddard Space Flight Center Scientific Visualization Studio The Blue Marble Next Generation data is courtesy of Reto Stockli (NASA/GSFC).
NASA/Goddard Space Flight Center Scientific Visualization Studio The Blue Marble Next Generation data is courtesy of Reto Stockli (NASA/GSFC).
Short URL to share this page:
https://svs.gsfc.nasa.gov/3584
Mission:
Terra
Data Used:
Note: While we identify the data sets used in these visualizations, we do not store any further details nor the data sets themselves on our site.
Keywords:
SVS >> HDTV
SVS >> NDVI
DLESE >> Physical geography
GCMD >> Earth Science >> Land Surface >> Land Use/Land Cover >> Land Cover
SVS >> Hyperwall
SVS >> Copenhagen
SVS >> For Educators
SVS >> Food Chain
SVS >> Seasons >> Vegetation
NASA Science >> Earth
GCMD keywords can be found on the Internet with the following citation: Olsen, L.M., G. Major, K. Shein, J. Scialdone, S. Ritz, T. Stevens, M. Morahan, A. Aleman, R. Vogel, S. Leicester, H. Weir, M. Meaux, S. Grebas, C.Solomon, M. Holland, T. Northcutt, R. A. Restrepo, R. Bilodeau, 2013. NASA/Global Change Master Directory (GCMD) Earth Science Keywords. Version 8.0.0.0.0
https://svs.gsfc.nasa.gov/3584
Mission:
Terra
Data Used:
Terra/MODIS/NDVI
2004-1-1 to 2004-12-31Keywords:
SVS >> HDTV
SVS >> NDVI
DLESE >> Physical geography
GCMD >> Earth Science >> Land Surface >> Land Use/Land Cover >> Land Cover
SVS >> Hyperwall
SVS >> Copenhagen
SVS >> For Educators
SVS >> Food Chain
SVS >> Seasons >> Vegetation
NASA Science >> Earth
GCMD keywords can be found on the Internet with the following citation: Olsen, L.M., G. Major, K. Shein, J. Scialdone, S. Ritz, T. Stevens, M. Morahan, A. Aleman, R. Vogel, S. Leicester, H. Weir, M. Meaux, S. Grebas, C.Solomon, M. Holland, T. Northcutt, R. A. Restrepo, R. Bilodeau, 2013. NASA/Global Change Master Directory (GCMD) Earth Science Keywords. Version 8.0.0.0.0


