Earth
ID: 3468
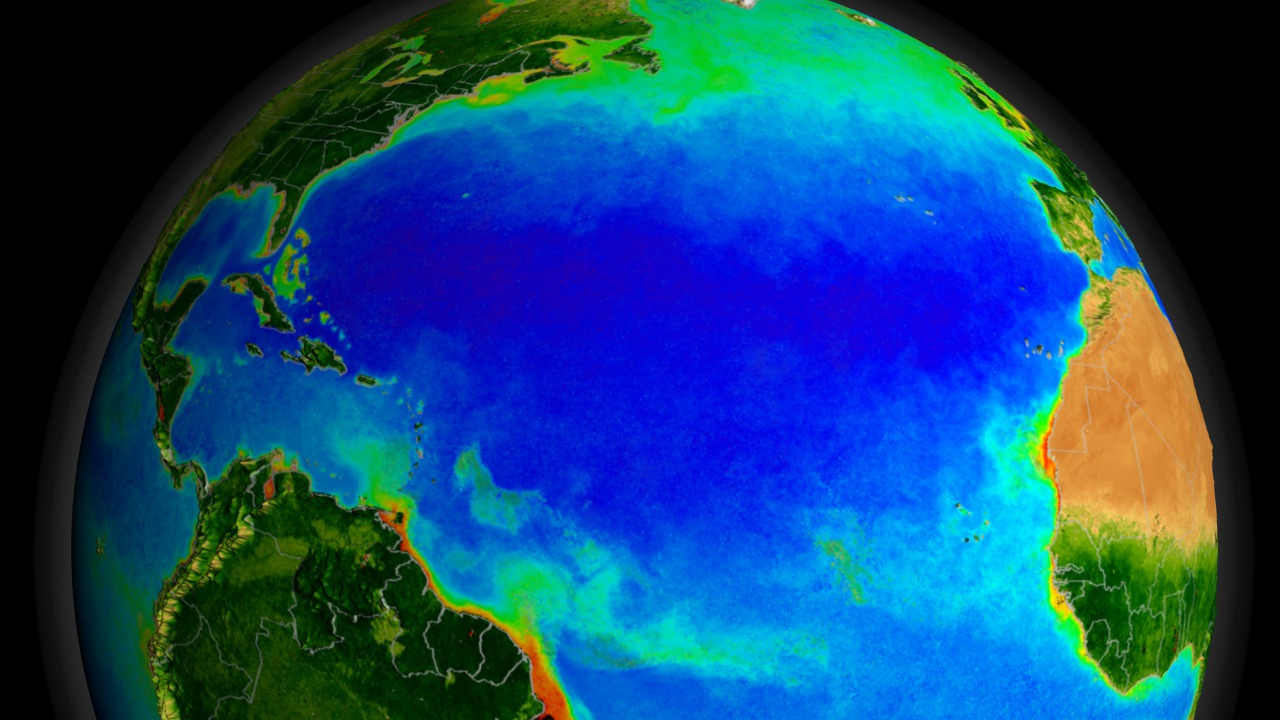
The SeaWiFS instrument aboard the Seastar satellite has been collecting ocean data since 1997. By monitoring the color of reflected light via satellite, scientists can determine how successfully plant life is photosynthesizing. A measurement of photosynthesis is essentially a measurement of successful growth, and growth means successful use of ambient carbon. This animation represents nearly a decade's worth of data taken by the SeaWiFS instrument, showing the abundance of life in the sea. Dark blue represents warmer areas where there is little life due to lack of nutrients, and greens and reds represent cooler nutrient-rich areas. The nutrient-rich areas include coastal regions where cold water rises from the sea floor bringing nutrients along and areas at the mouths of rivers where the rivers have brought nutrients into the ocean from the land.
SeaWiFS Biosphere Data over the North Atlantic (Slow Version)
This animation is essentially the same as animation #3450 with a few minor changes and runs at half the speed.
Visualization Credits
Alex Kekesi (Global Science and Technology, Inc.): Lead Animator
Gene Feldman (NASA/GSFC): Scientist
Michael Behrenfeld (Oregon State University): Scientist
Gene Feldman (NASA/GSFC): Scientist
Michael Behrenfeld (Oregon State University): Scientist
Please give credit for this item to:
NASA/Goddard Space Flight Center, The SeaWiFS Project and GeoEye, Scientific Visualization Studio. NOTE: All SeaWiFS images and data presented on this web site are for research and educational use only. All commercial use of SeaWiFS data must be coordinated with GeoEye (NOTE: In January 2013, DigitalGlobe and GeoEye combined to become DigitalGlobe).
Data provided by: Norman Kuring (NASA/GSFC)
Short URL to share this page:
https://svs.gsfc.nasa.gov/3468
Data Used:
Note: While we identify the data sets used in these visualizations, we do not store any further details nor the data sets themselves on our site.
Dates of Data Used:
08/29/1997 - 10/23/2006
This item is part of this series:
Ocean Productivity
Keywords:
DLESE >> Chemical oceanography
DLESE >> Ecology
DLESE >> Environmental science
SVS >> HDTV
DLESE >> Hydrology
DLESE >> Physical oceanography
GCMD >> Earth Science >> Biosphere
GCMD >> Earth Science >> Climate Indicators
GCMD >> Earth Science >> Biosphere >> Vegetation
GCMD >> Earth Science >> Biosphere >> Ecological Dynamics >> Food-web Dynamics
GCMD >> Earth Science >> Biosphere >> Microbiota >> Chlorophyll
GCMD >> Earth Science >> Biosphere >> Vegetation >> Chlorophyll
GCMD >> Earth Science >> Biosphere >> Vegetation >> Vegetation Index
GCMD >> Earth Science >> Hydrosphere >> Water Quality/Water Chemistry >> Chlorophyll
GCMD >> Earth Science >> Oceans >> Ocean Chemistry >> Chlorophyll
SVS >> Hyperwall
NASA Science >> Earth
GCMD keywords can be found on the Internet with the following citation: Olsen, L.M., G. Major, K. Shein, J. Scialdone, S. Ritz, T. Stevens, M. Morahan, A. Aleman, R. Vogel, S. Leicester, H. Weir, M. Meaux, S. Grebas, C.Solomon, M. Holland, T. Northcutt, R. A. Restrepo, R. Bilodeau, 2013. NASA/Global Change Master Directory (GCMD) Earth Science Keywords. Version 8.0.0.0.0
https://svs.gsfc.nasa.gov/3468
Data Used:
SeaStar/SeaWiFS/Global Biosphere
08/29/1997 - 10/23/2006
SeaWiFS Global Biosphere is a combination of the Land NDVI and Chlorophyll Concentration data sets. All SeaWiFS images and data presented on this web site are for research and educational use only. All commercial use of SeaWiFS data must be coordinated with GeoEye.
Credit:
NASA/Goddard Space Flight Center, The SeaWiFS Project and GeoEye, Scientific Visualization Studio. NOTE: All SeaWiFS images and data presented on this web site are for research and educational use only. All commercial use of SeaWiFS data must be coordinated with GeoEye (NOTE: In January 2013, DigitalGlobe and GeoEye combined to become one DigitalGlobe.).
NASA/Goddard Space Flight Center, The SeaWiFS Project and GeoEye, Scientific Visualization Studio. NOTE: All SeaWiFS images and data presented on this web site are for research and educational use only. All commercial use of SeaWiFS data must be coordinated with GeoEye (NOTE: In January 2013, DigitalGlobe and GeoEye combined to become one DigitalGlobe.).
Dates of Data Used:
08/29/1997 - 10/23/2006
This item is part of this series:
Ocean Productivity
Keywords:
DLESE >> Chemical oceanography
DLESE >> Ecology
DLESE >> Environmental science
SVS >> HDTV
DLESE >> Hydrology
DLESE >> Physical oceanography
GCMD >> Earth Science >> Biosphere
GCMD >> Earth Science >> Climate Indicators
GCMD >> Earth Science >> Biosphere >> Vegetation
GCMD >> Earth Science >> Biosphere >> Ecological Dynamics >> Food-web Dynamics
GCMD >> Earth Science >> Biosphere >> Microbiota >> Chlorophyll
GCMD >> Earth Science >> Biosphere >> Vegetation >> Chlorophyll
GCMD >> Earth Science >> Biosphere >> Vegetation >> Vegetation Index
GCMD >> Earth Science >> Hydrosphere >> Water Quality/Water Chemistry >> Chlorophyll
GCMD >> Earth Science >> Oceans >> Ocean Chemistry >> Chlorophyll
SVS >> Hyperwall
NASA Science >> Earth
GCMD keywords can be found on the Internet with the following citation: Olsen, L.M., G. Major, K. Shein, J. Scialdone, S. Ritz, T. Stevens, M. Morahan, A. Aleman, R. Vogel, S. Leicester, H. Weir, M. Meaux, S. Grebas, C.Solomon, M. Holland, T. Northcutt, R. A. Restrepo, R. Bilodeau, 2013. NASA/Global Change Master Directory (GCMD) Earth Science Keywords. Version 8.0.0.0.0


