Sun
ID: 3391
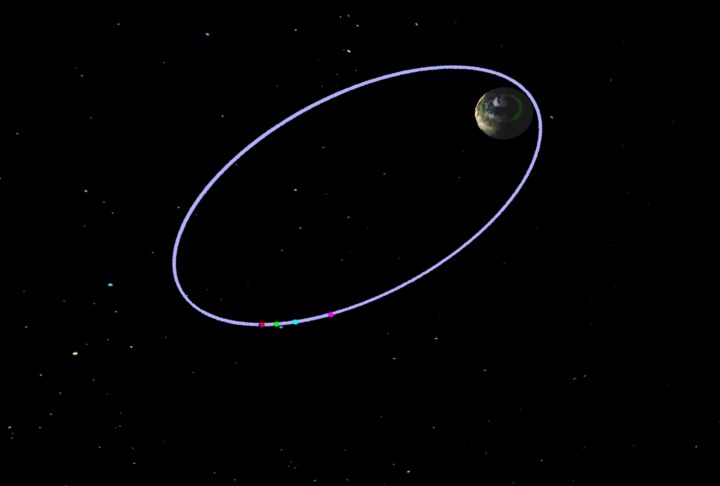
In the early part of the mission, the five THEMIS satellites will follow the same orbit single-file. The apogee of the orbit will take the spacecraft just beyond the bow shock of the Earth's magnetosphere. This will enable the satellites to collect data in this region over a short range of time so that the time history can be studied. The dates in this visualization are based on an ephemeris assuming a launch on January 20, 2007. The satellite colors are: red=P1, green=P2, cyan=P3, blue=P4, magenta=P5.


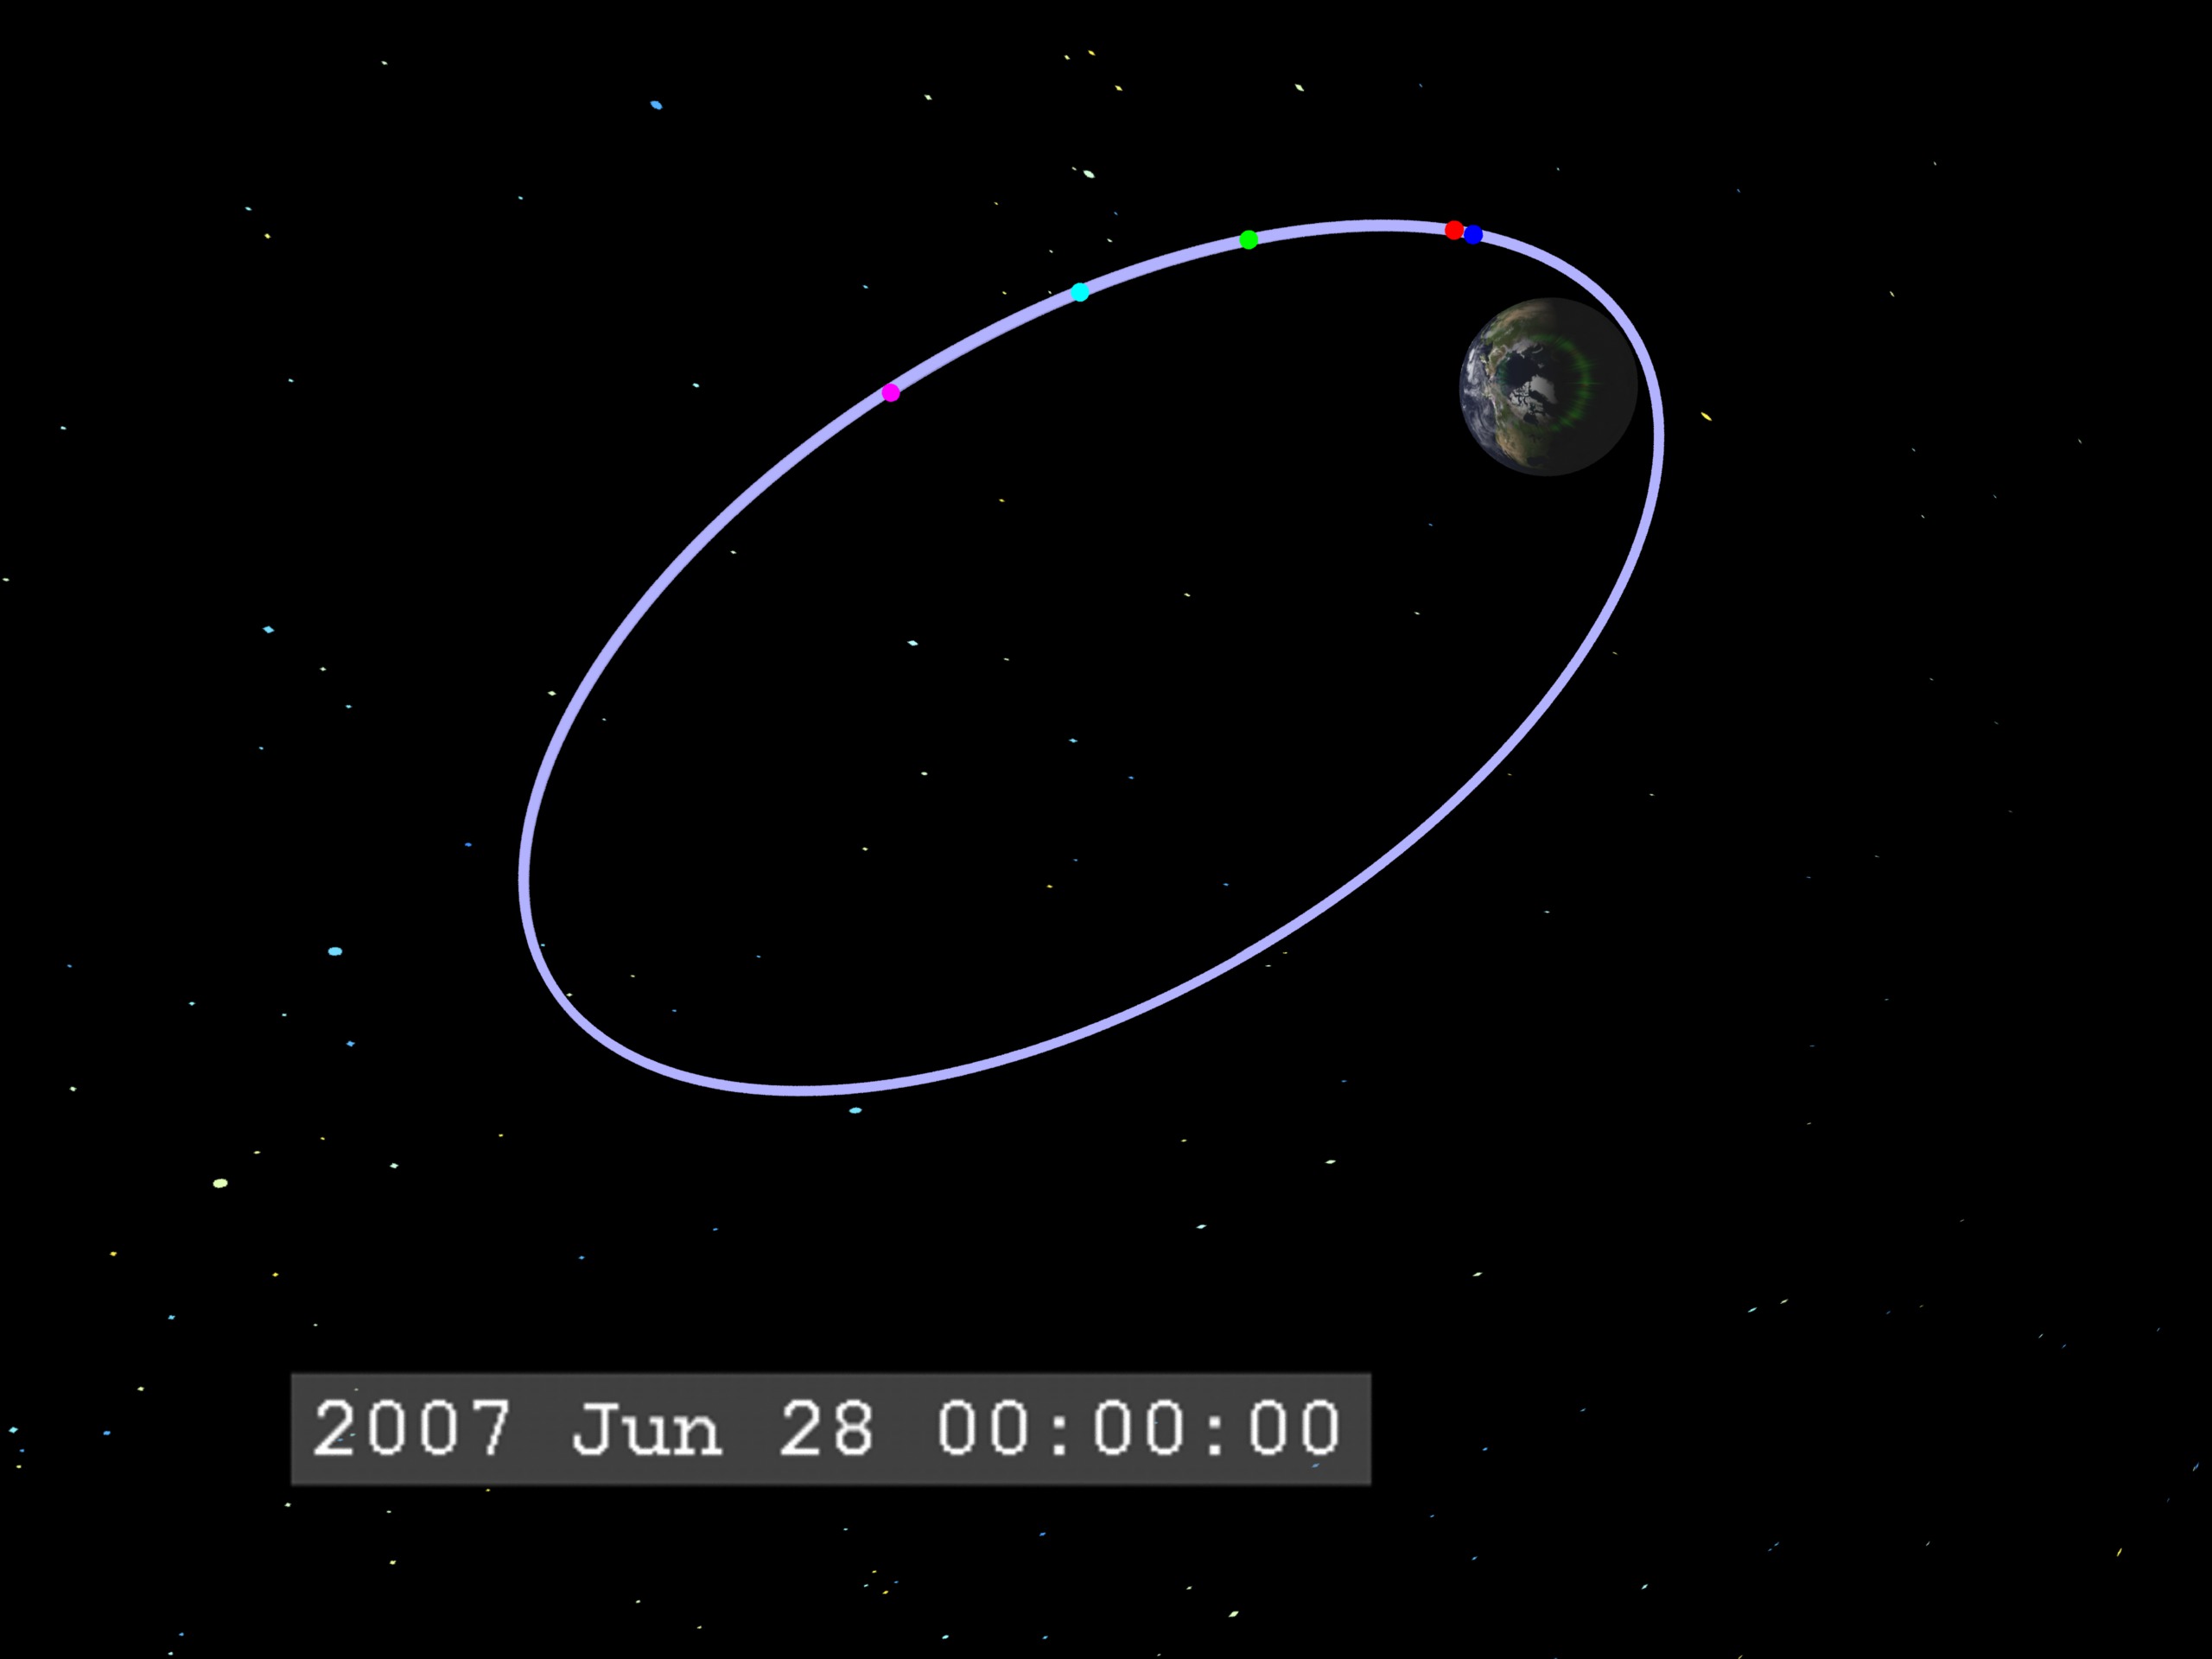

THEMIS Orbits: Dayside Science Configuration
Visualization Credits
Tom Bridgman (Global Science and Technology, Inc.): Lead Animator
Vassilis Angelopoulos (University of California at Berkeley): Scientist
David G. Sibeck (NASA/GSFC): Scientist
Vassilis Angelopoulos (University of California at Berkeley): Scientist
David G. Sibeck (NASA/GSFC): Scientist
Please give credit for this item to:
NASA/Goddard Space Flight Center Scientific Visualization Studio
NASA/Goddard Space Flight Center Scientific Visualization Studio
Short URL to share this page:
https://svs.gsfc.nasa.gov/3391
Mission:
THEMIS
Data Used:
Note: While we identify the data sets used in these visualizations, we do not store any further details nor the data sets themselves on our site.
This item is part of this series:
THEMIS Pre-launch
Keywords:
SVS >> Geomagnetic Field
SVS >> Magnetosphere
SVS >> Solar Wind
GCMD >> Location >> Bow Shock
SVS >> THEMIS
NASA Science >> Sun
GCMD keywords can be found on the Internet with the following citation: Olsen, L.M., G. Major, K. Shein, J. Scialdone, S. Ritz, T. Stevens, M. Morahan, A. Aleman, R. Vogel, S. Leicester, H. Weir, M. Meaux, S. Grebas, C.Solomon, M. Holland, T. Northcutt, R. A. Restrepo, R. Bilodeau, 2013. NASA/Global Change Master Directory (GCMD) Earth Science Keywords. Version 8.0.0.0.0
https://svs.gsfc.nasa.gov/3391
Mission:
THEMIS
Data Used:
SSCweb also referred to as: SSCweb ephemerides
Ephemeris - NASA/GSFC Space Physics Data Facility - 2007/06/25T00:00:00 - 2007/06/28T00:00:00
Satellite ephemerides
This item is part of this series:
THEMIS Pre-launch
Keywords:
SVS >> Geomagnetic Field
SVS >> Magnetosphere
SVS >> Solar Wind
GCMD >> Location >> Bow Shock
SVS >> THEMIS
NASA Science >> Sun
GCMD keywords can be found on the Internet with the following citation: Olsen, L.M., G. Major, K. Shein, J. Scialdone, S. Ritz, T. Stevens, M. Morahan, A. Aleman, R. Vogel, S. Leicester, H. Weir, M. Meaux, S. Grebas, C.Solomon, M. Holland, T. Northcutt, R. A. Restrepo, R. Bilodeau, 2013. NASA/Global Change Master Directory (GCMD) Earth Science Keywords. Version 8.0.0.0.0


