Earth
ID: 3378
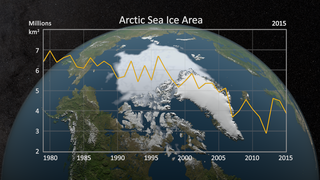
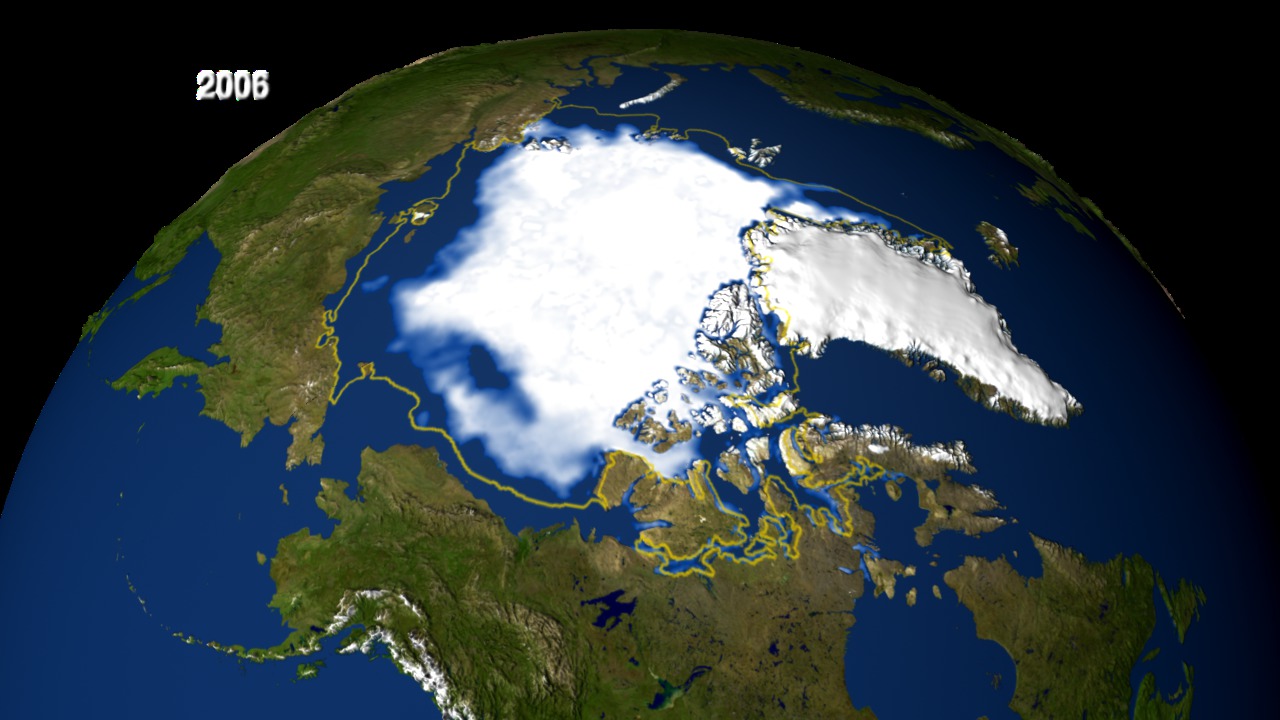
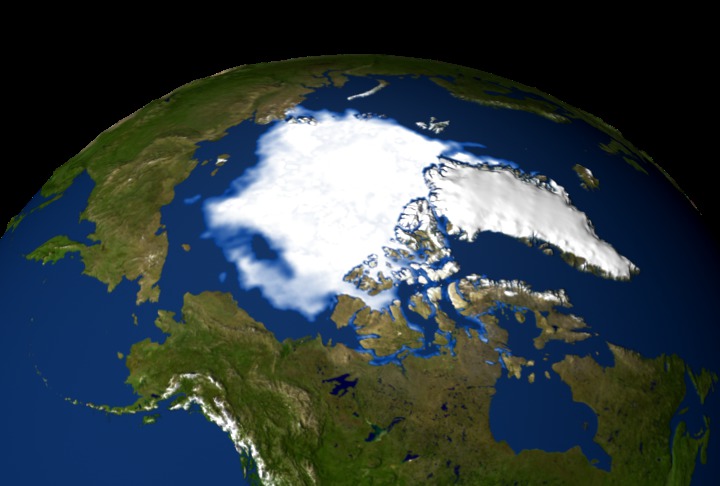
This animation shows the annual minimum Arctic sea ice extent and concentration from 1979 to 2006. Average climatology from 1979 to 2004 is shown as a yellow outline.

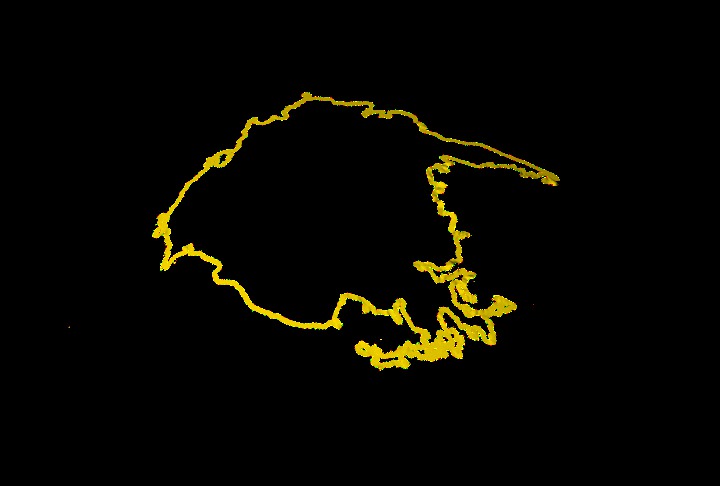
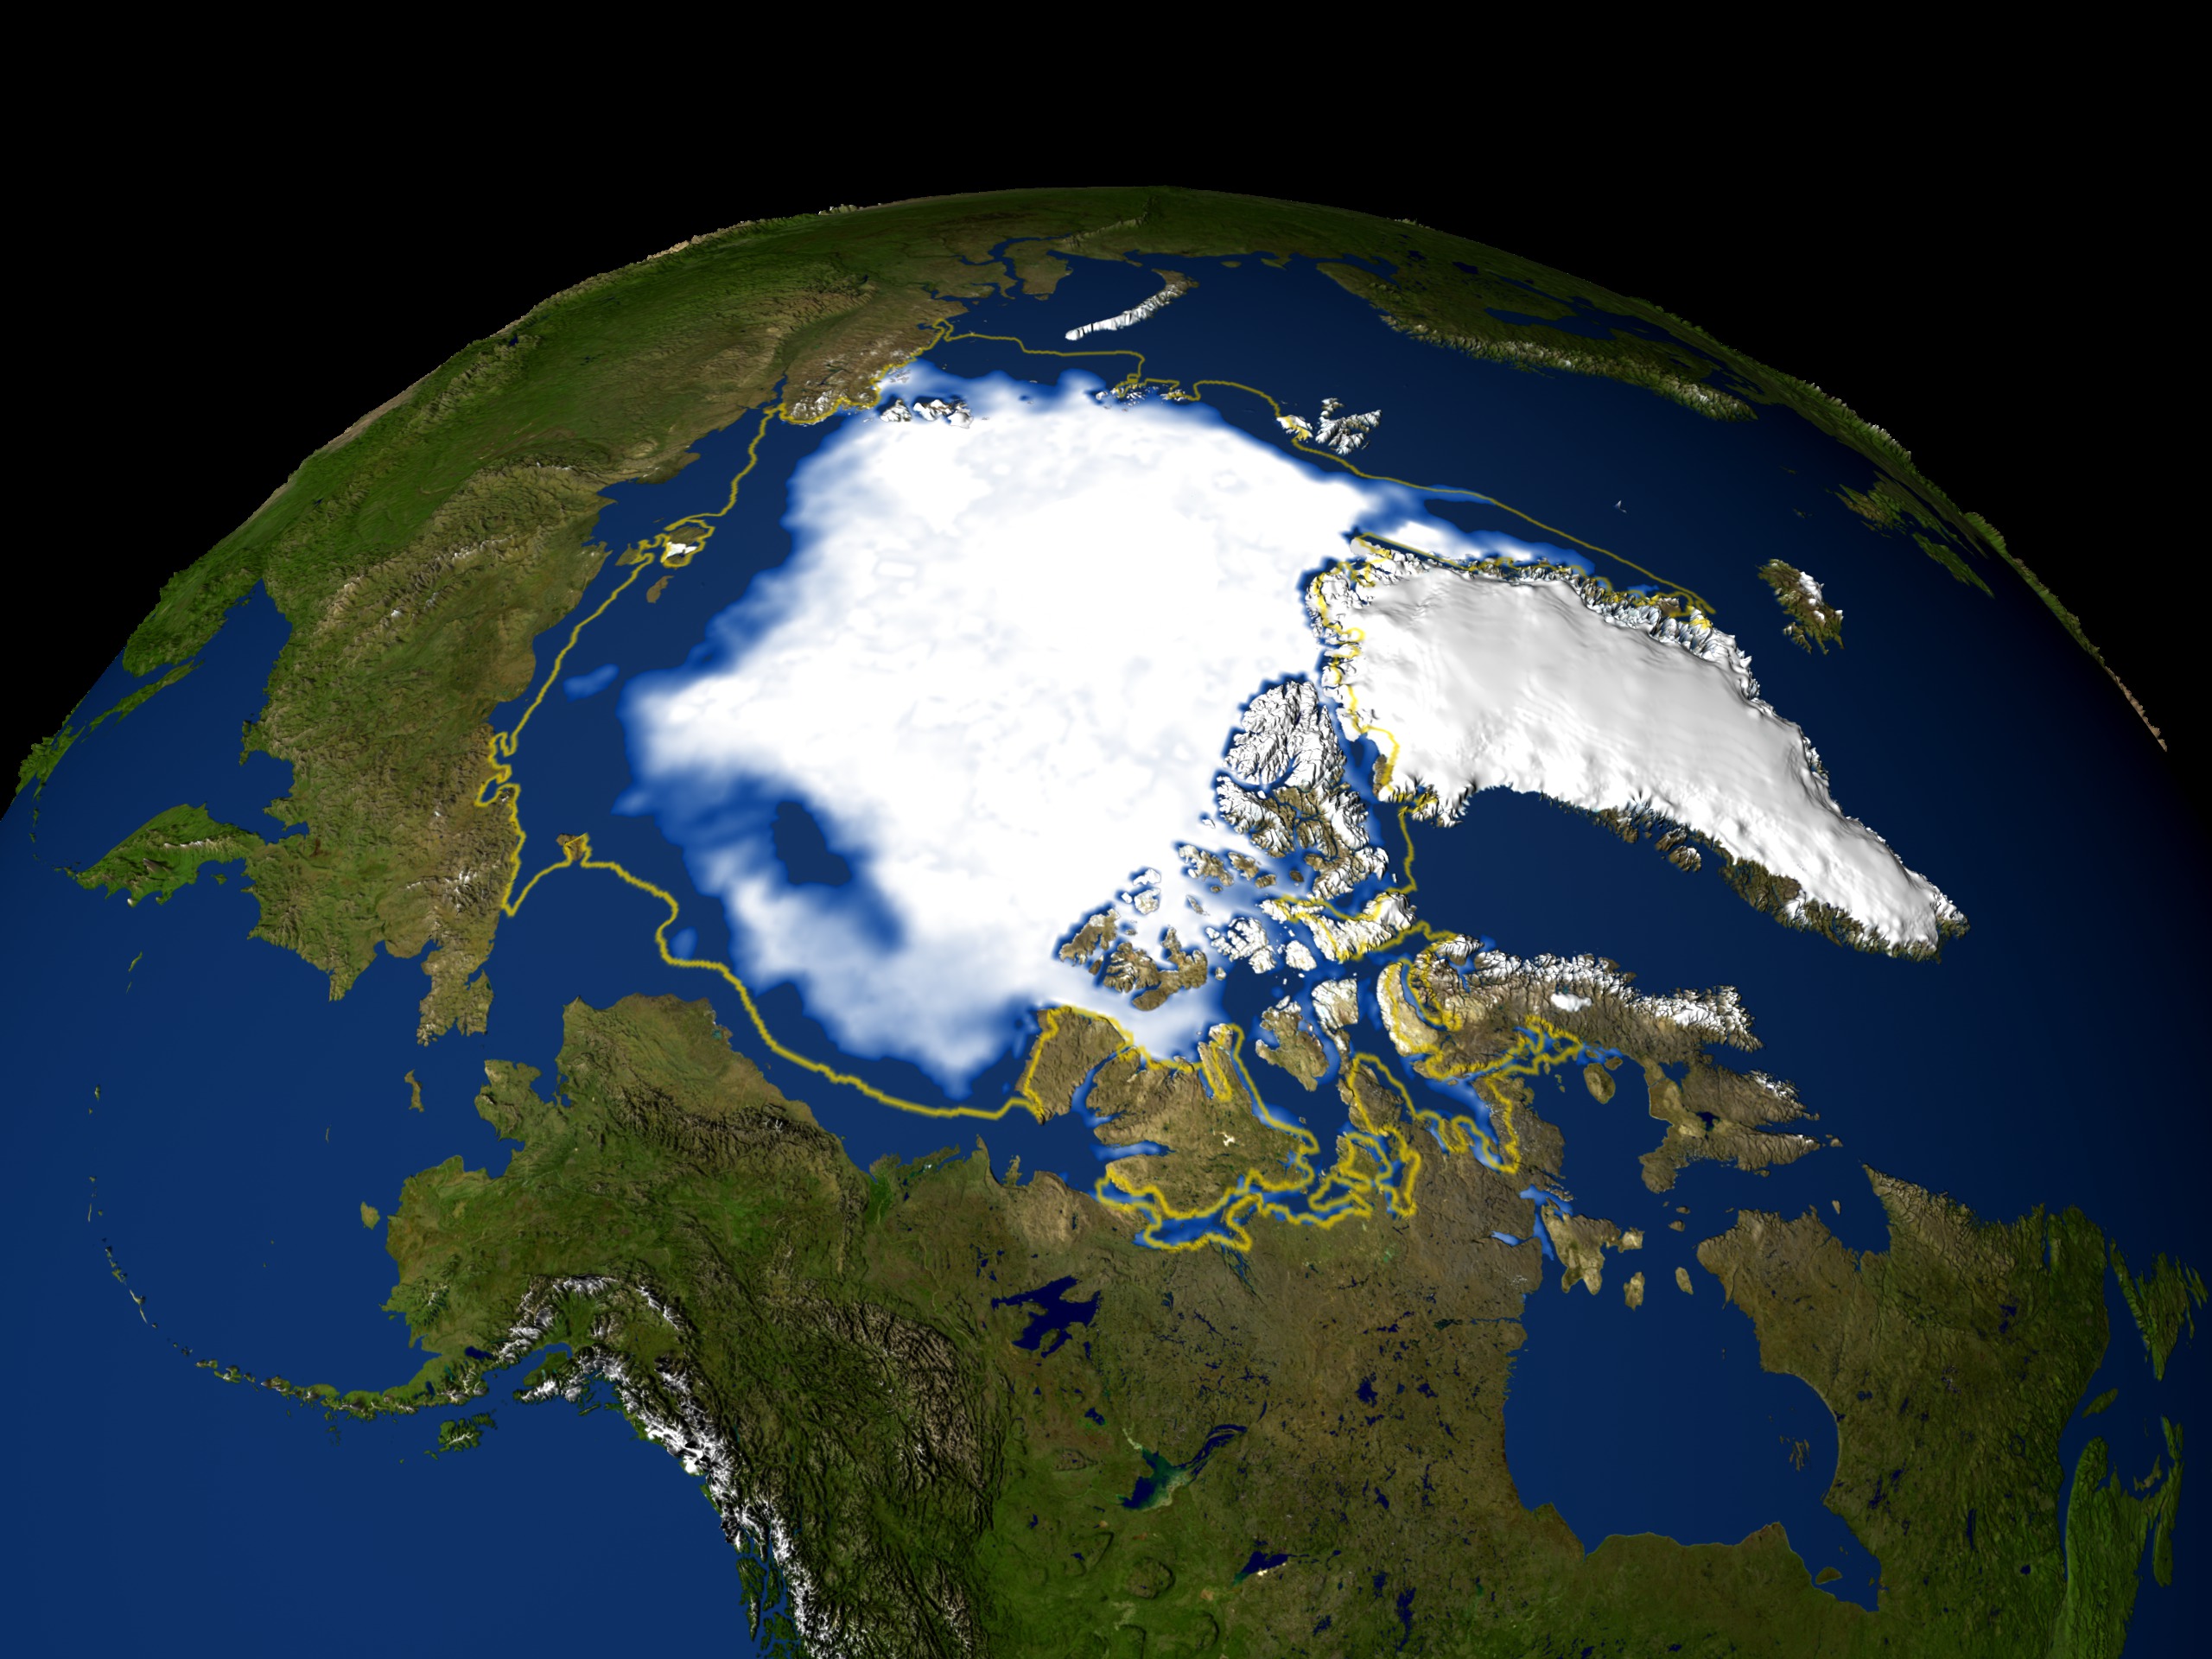
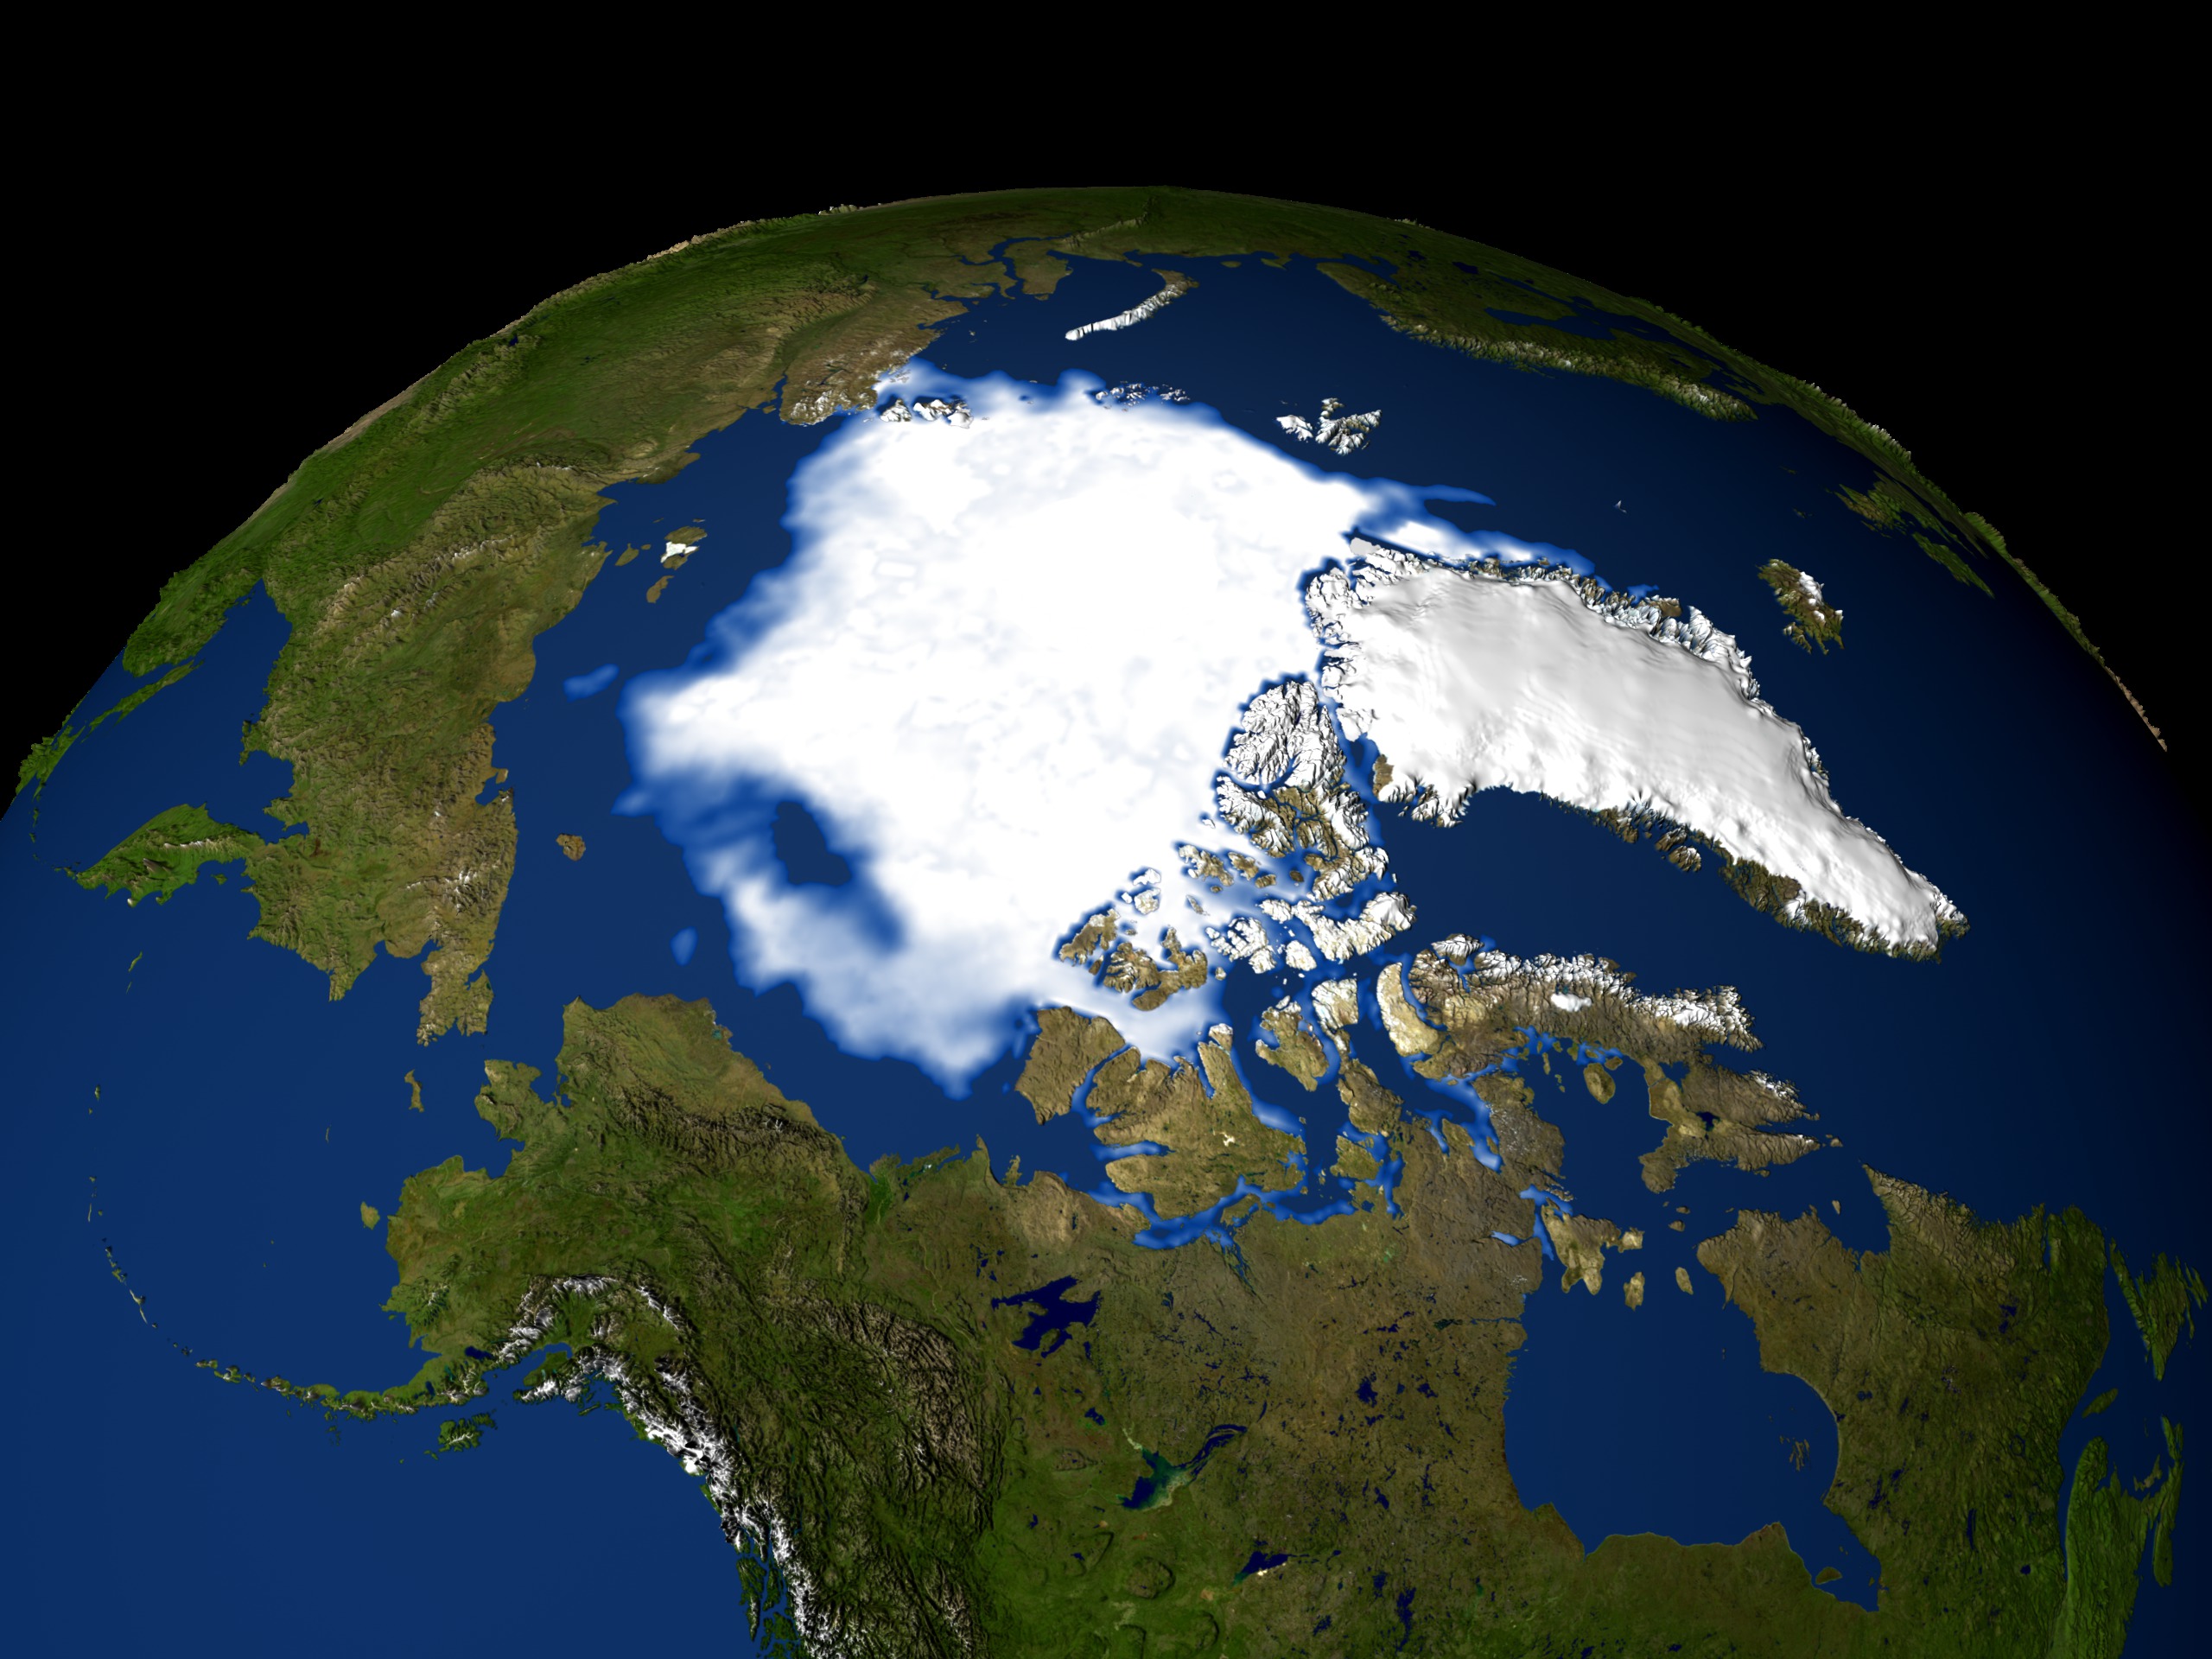
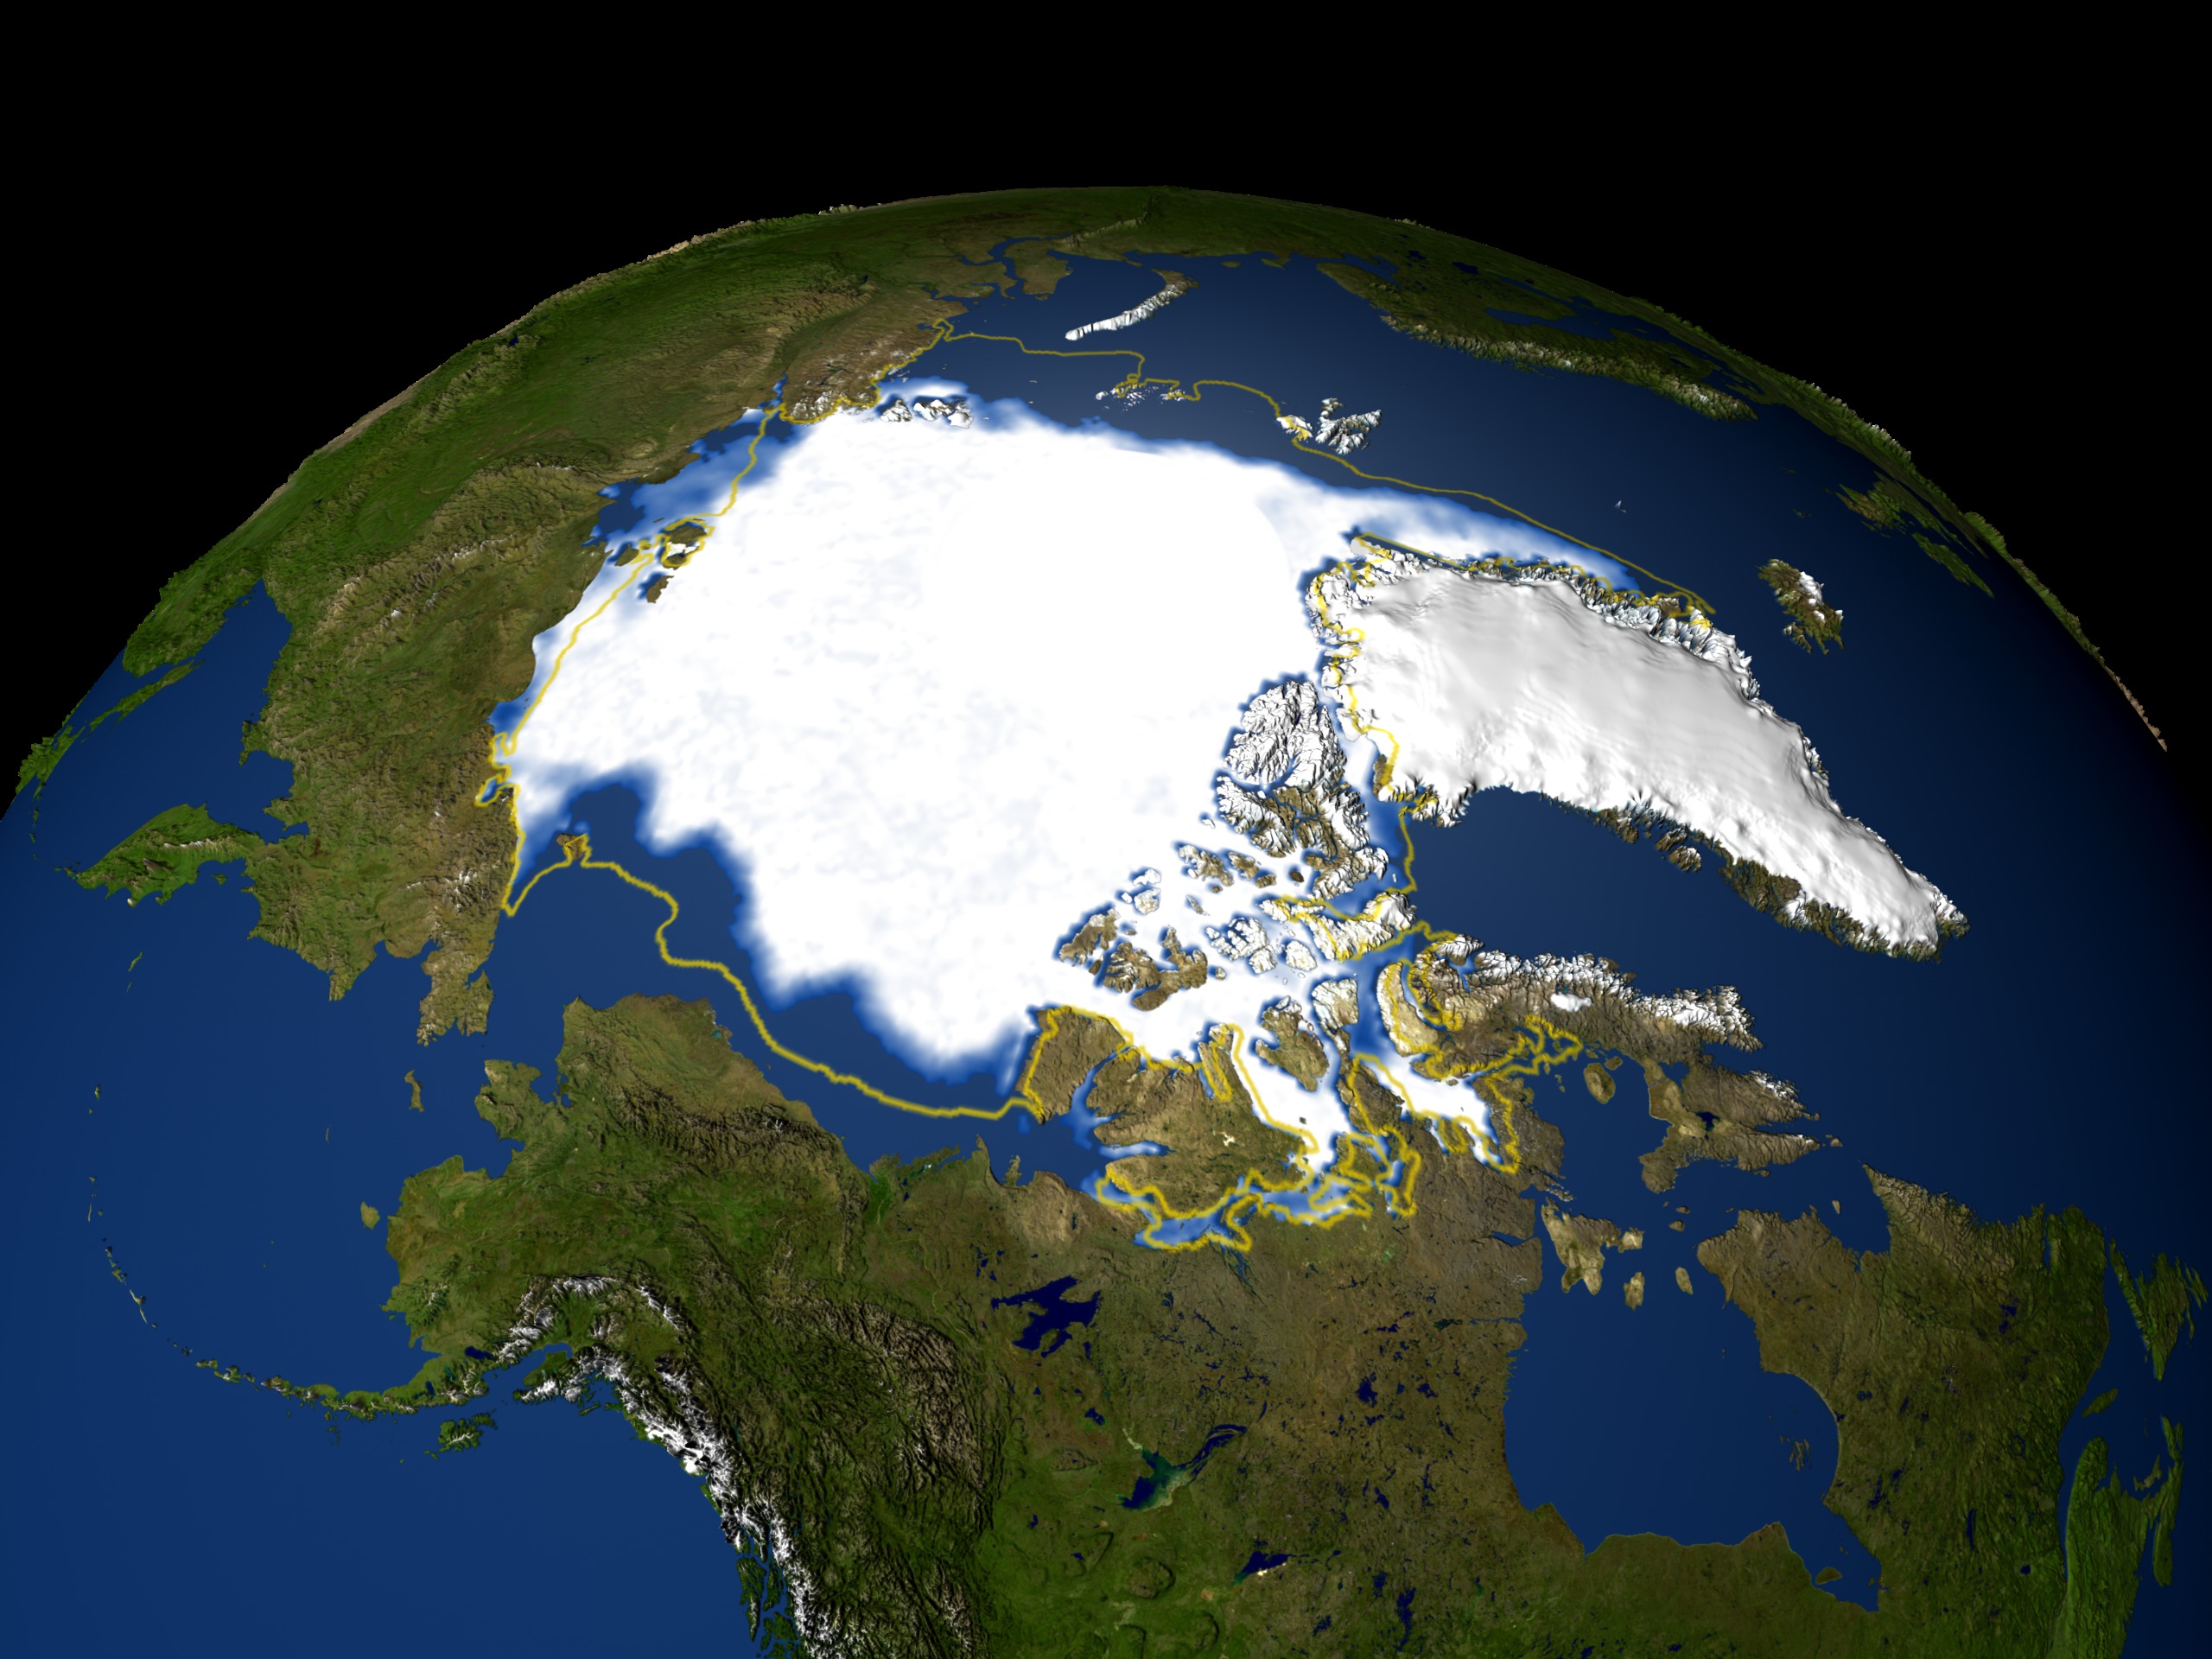
Arctic Sea Ice Minimum Concentration for 1979-2006
There is a newer version of this story located here: https://svs.gsfc.nasa.gov/4435
Newer Version
Visualization Credits
Please give credit for this item to:
NASA/Goddard Space Flight Center Scientific Visualization Studio
NASA/Goddard Space Flight Center Scientific Visualization Studio
Short URL to share this page:
https://svs.gsfc.nasa.gov/3378
Data Used:
Note: While we identify the data sets used in these visualizations, we do not store any further details nor the data sets themselves on our site.
Goddard TV Tape:
G2007-001HD -- NASA's HD Climate Change Resource Tape
Keywords:
SVS >> HDTV
SVS >> Ice
GCMD >> Earth Science >> Cryosphere >> Sea Ice >> Ice Extent
NASA Science >> Earth
GCMD keywords can be found on the Internet with the following citation: Olsen, L.M., G. Major, K. Shein, J. Scialdone, S. Ritz, T. Stevens, M. Morahan, A. Aleman, R. Vogel, S. Leicester, H. Weir, M. Meaux, S. Grebas, C.Solomon, M. Holland, T. Northcutt, R. A. Restrepo, R. Bilodeau, 2013. NASA/Global Change Master Directory (GCMD) Earth Science Keywords. Version 8.0.0.0.0
https://svs.gsfc.nasa.gov/3378
Data Used:
DMSP/SSM/I
1979-2006
Defense Meteorological Satellite Program Special Sensor Microwave Imager
Nimbus-7/SSMR/September Sea Ice Concentration Anomaly
September 2003Comiso's September Minimum Sea Ice Concentration
Data Compilation - NASA/GSFC - 1979-2006Goddard TV Tape:
G2007-001HD -- NASA's HD Climate Change Resource Tape
Keywords:
SVS >> HDTV
SVS >> Ice
GCMD >> Earth Science >> Cryosphere >> Sea Ice >> Ice Extent
NASA Science >> Earth
GCMD keywords can be found on the Internet with the following citation: Olsen, L.M., G. Major, K. Shein, J. Scialdone, S. Ritz, T. Stevens, M. Morahan, A. Aleman, R. Vogel, S. Leicester, H. Weir, M. Meaux, S. Grebas, C.Solomon, M. Holland, T. Northcutt, R. A. Restrepo, R. Bilodeau, 2013. NASA/Global Change Master Directory (GCMD) Earth Science Keywords. Version 8.0.0.0.0


