Earth
ID: 3370
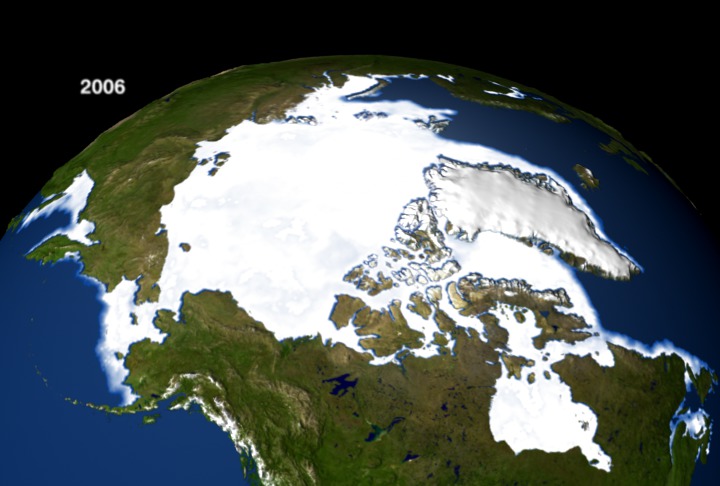
This visualization shows the annual maximum amount of winter Arctic ice from 1979 to 2006. In 2005 and 2006, the winter ice maximum was about 6% smaller than the average winter ice over the 26 year period. The expected winter ice retreat is 1.5 to 2% loss per decade. The same data is also shown with a yellow region representing the cumulative or maximum extent of winter ice observed from 1979 to 2006.


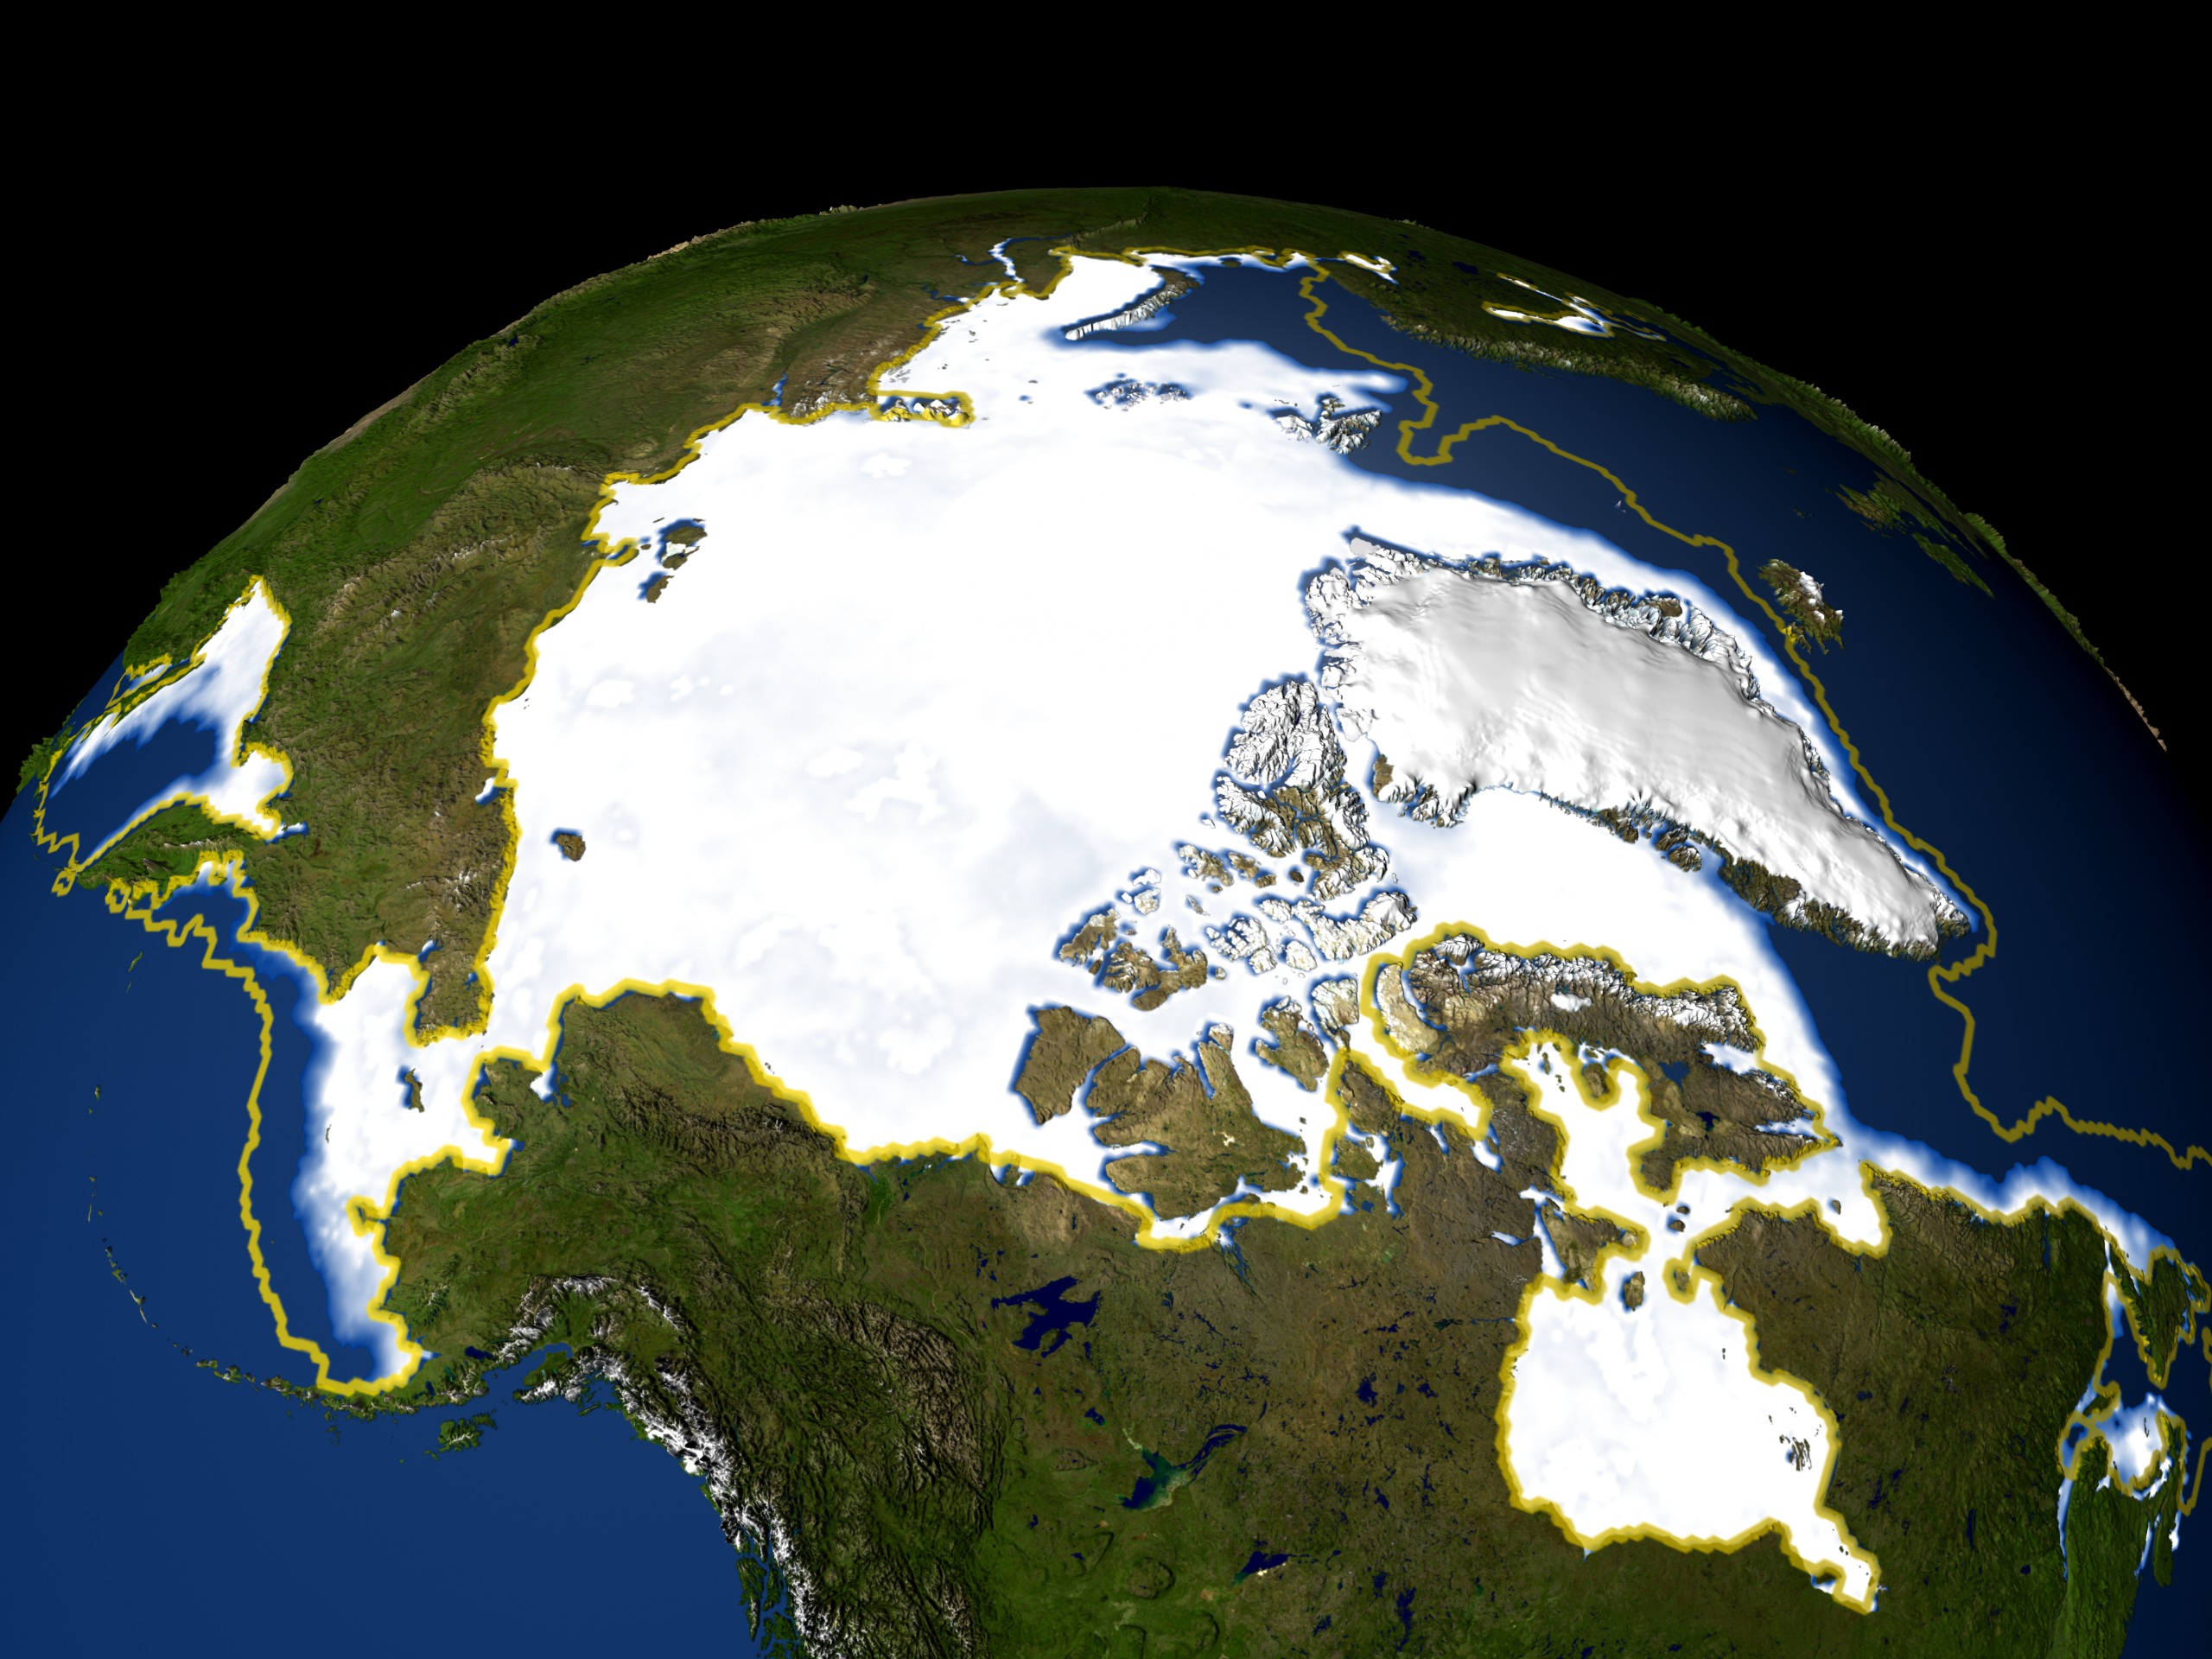
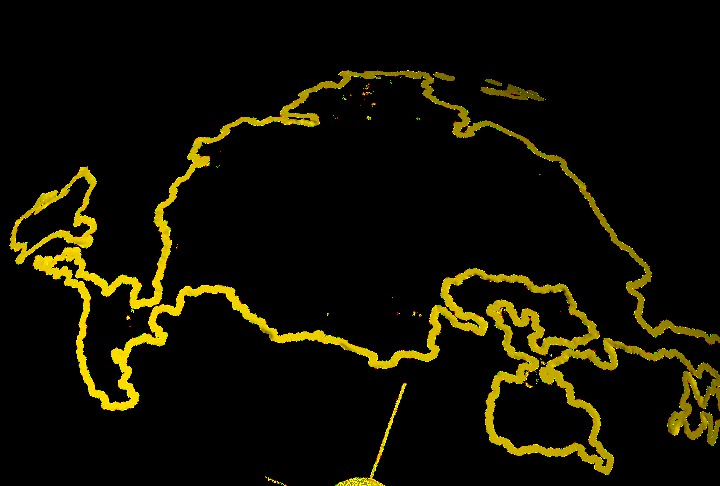
Arctic Sea Ice Maximum Concentrations 1979-2006
Related
Visualization Credits
Please give credit for this item to:
NASA/Goddard Space Flight Center Scientific Visualization Studio
NASA/Goddard Space Flight Center Scientific Visualization Studio
Short URL to share this page:
https://svs.gsfc.nasa.gov/3370
Data Used:
Note: While we identify the data sets used in these visualizations, we do not store any further details nor the data sets themselves on our site.
Keywords:
DLESE >> Cryology
GCMD >> Earth Science >> Cryosphere >> Sea Ice >> Ice Extent
NASA Science >> Earth
GCMD keywords can be found on the Internet with the following citation: Olsen, L.M., G. Major, K. Shein, J. Scialdone, S. Ritz, T. Stevens, M. Morahan, A. Aleman, R. Vogel, S. Leicester, H. Weir, M. Meaux, S. Grebas, C.Solomon, M. Holland, T. Northcutt, R. A. Restrepo, R. Bilodeau, 2013. NASA/Global Change Master Directory (GCMD) Earth Science Keywords. Version 8.0.0.0.0
https://svs.gsfc.nasa.gov/3370
Data Used:
DMSP/SSM/I
1979-2006
Defense Meteorological Satellite Program Special Sensor Microwave Imager
Comiso's Yearly Maximum Sea Ice Concentration
Data Compilation - NASA/GSFC - 1979-2006Keywords:
DLESE >> Cryology
GCMD >> Earth Science >> Cryosphere >> Sea Ice >> Ice Extent
NASA Science >> Earth
GCMD keywords can be found on the Internet with the following citation: Olsen, L.M., G. Major, K. Shein, J. Scialdone, S. Ritz, T. Stevens, M. Morahan, A. Aleman, R. Vogel, S. Leicester, H. Weir, M. Meaux, S. Grebas, C.Solomon, M. Holland, T. Northcutt, R. A. Restrepo, R. Bilodeau, 2013. NASA/Global Change Master Directory (GCMD) Earth Science Keywords. Version 8.0.0.0.0


