Earth
ID: 3362
From hot towers to phytoplankton blooms, NASA's cutting-edge hurricane research has been revealing never-before-seen aspects of these giant storms for over a decade. The past three years have seen great progress in the areas of intensity monitoring and 3-D modeling of hurricanes. In 2006, scientists at NASA and other institutions have more tools than ever to study these storms using the very latest in ground, air, and space-based technology.
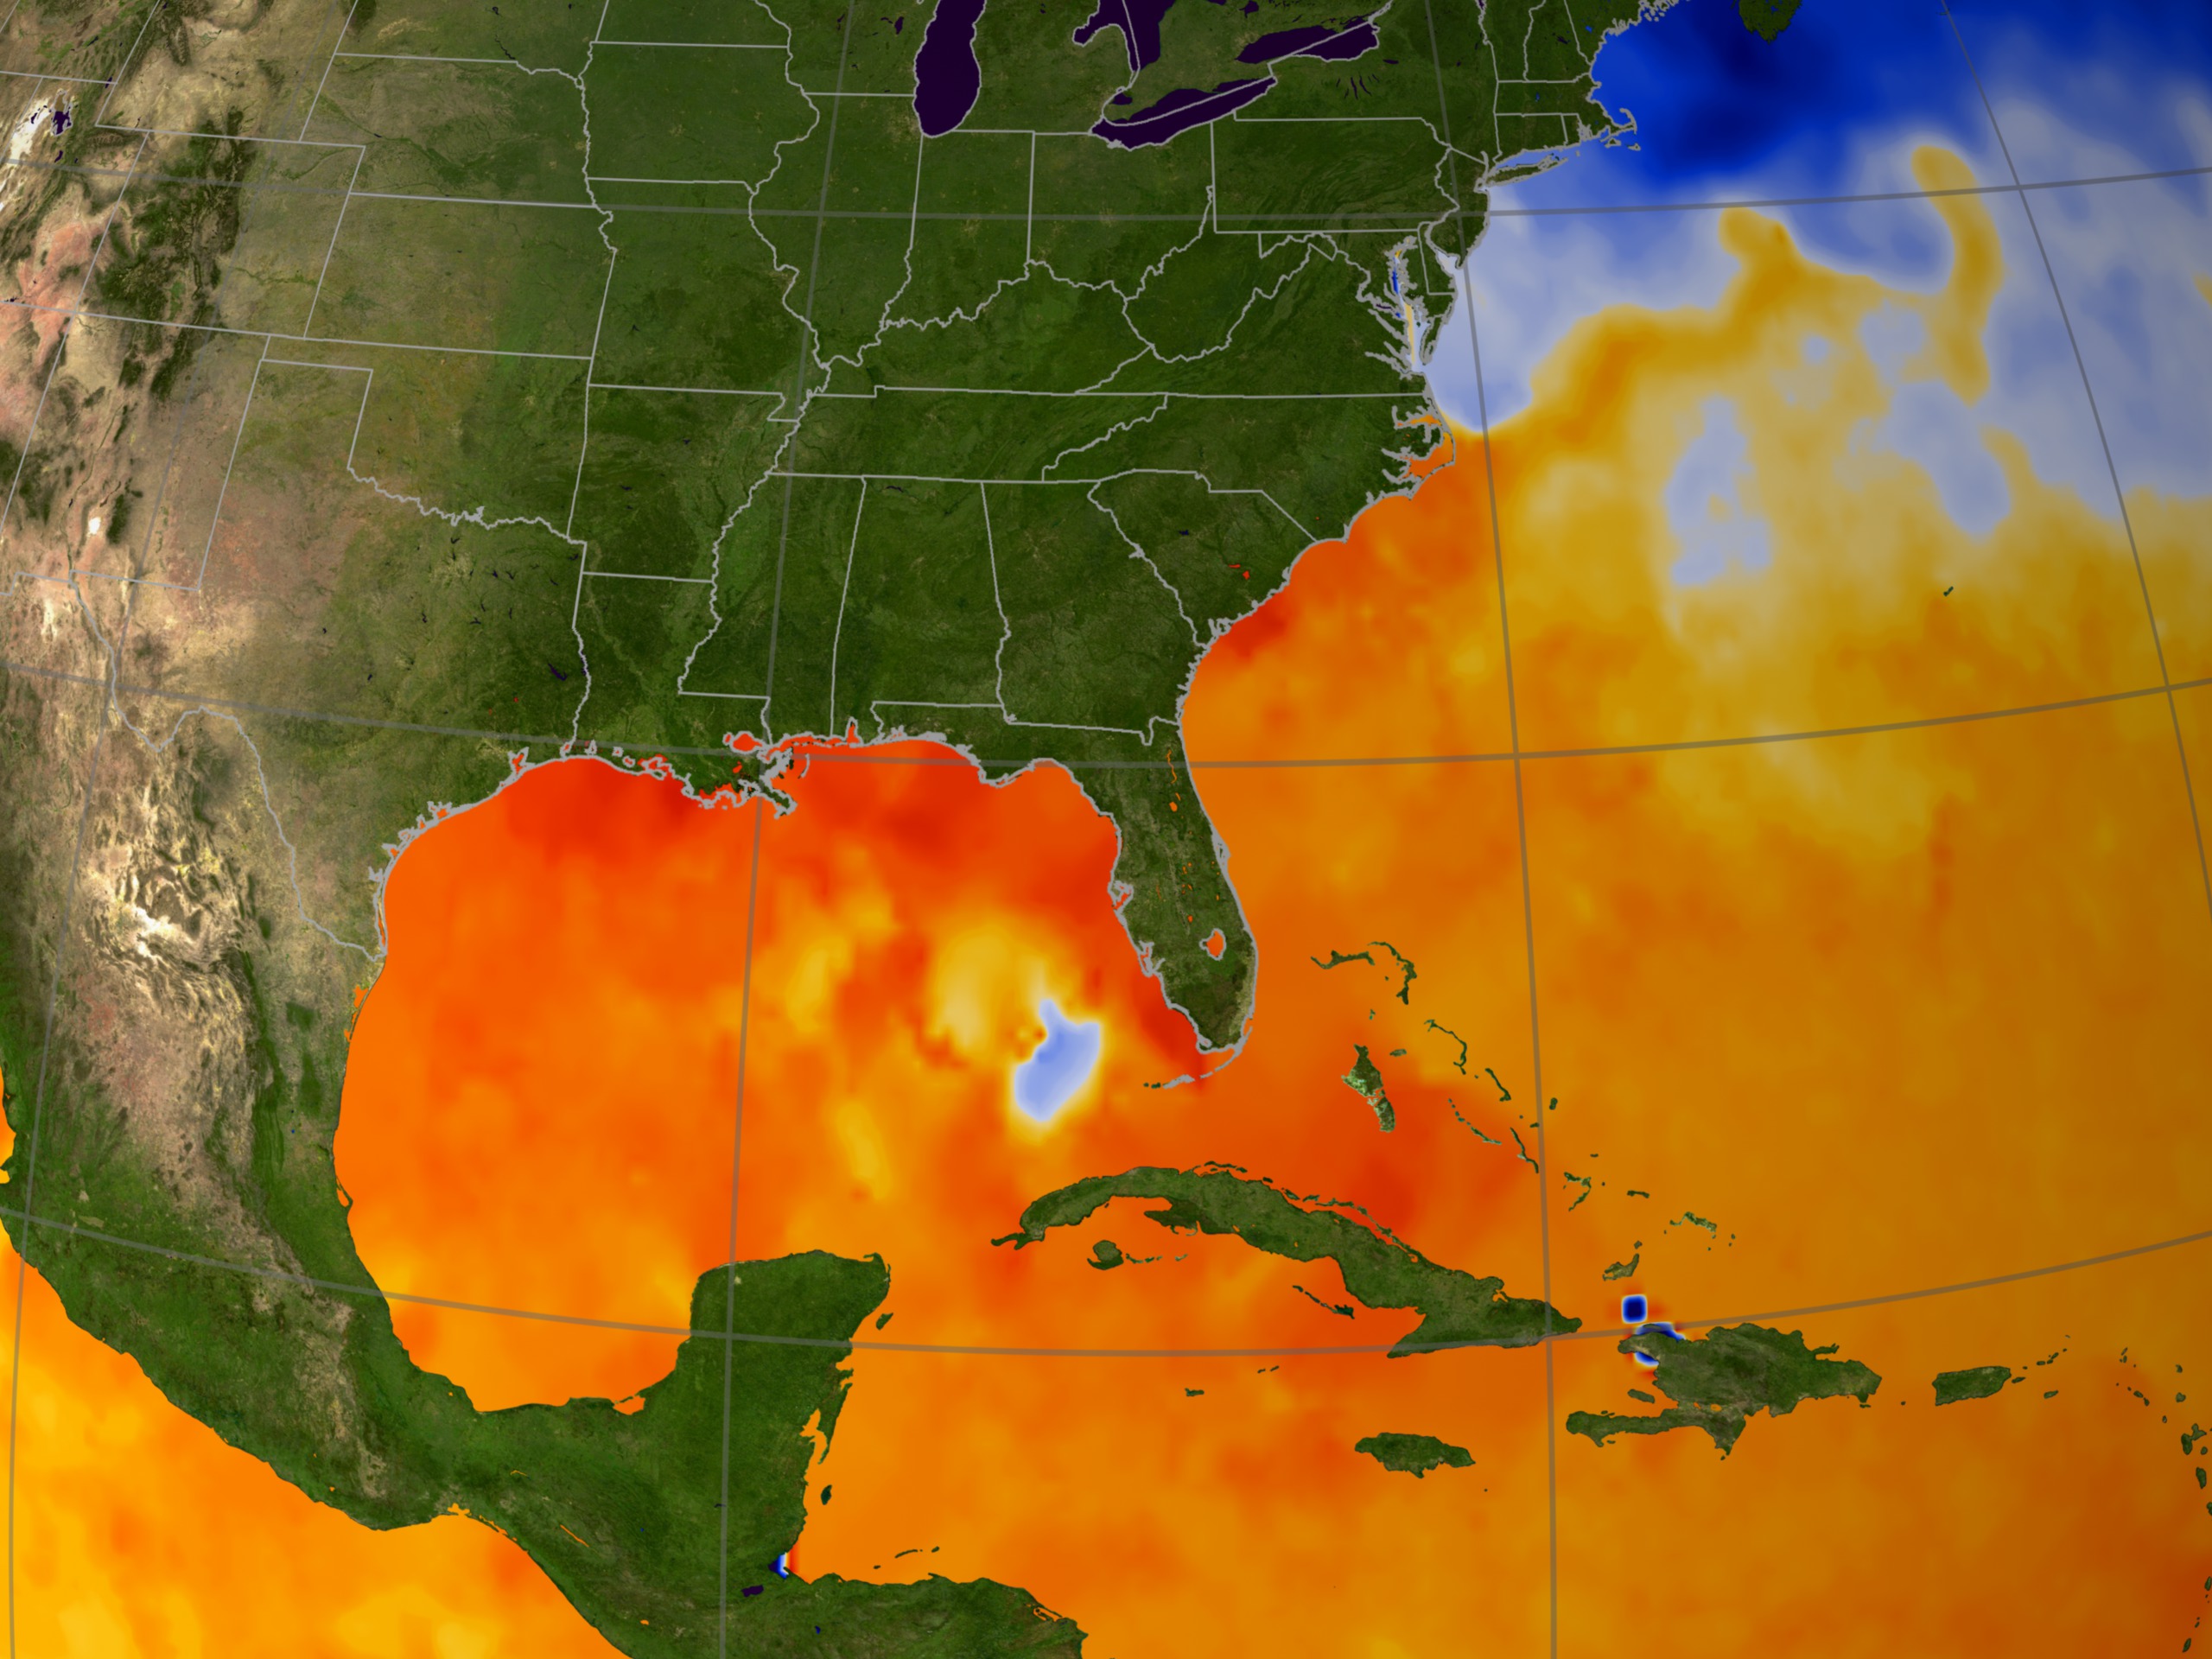
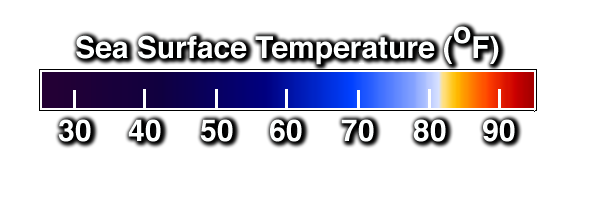
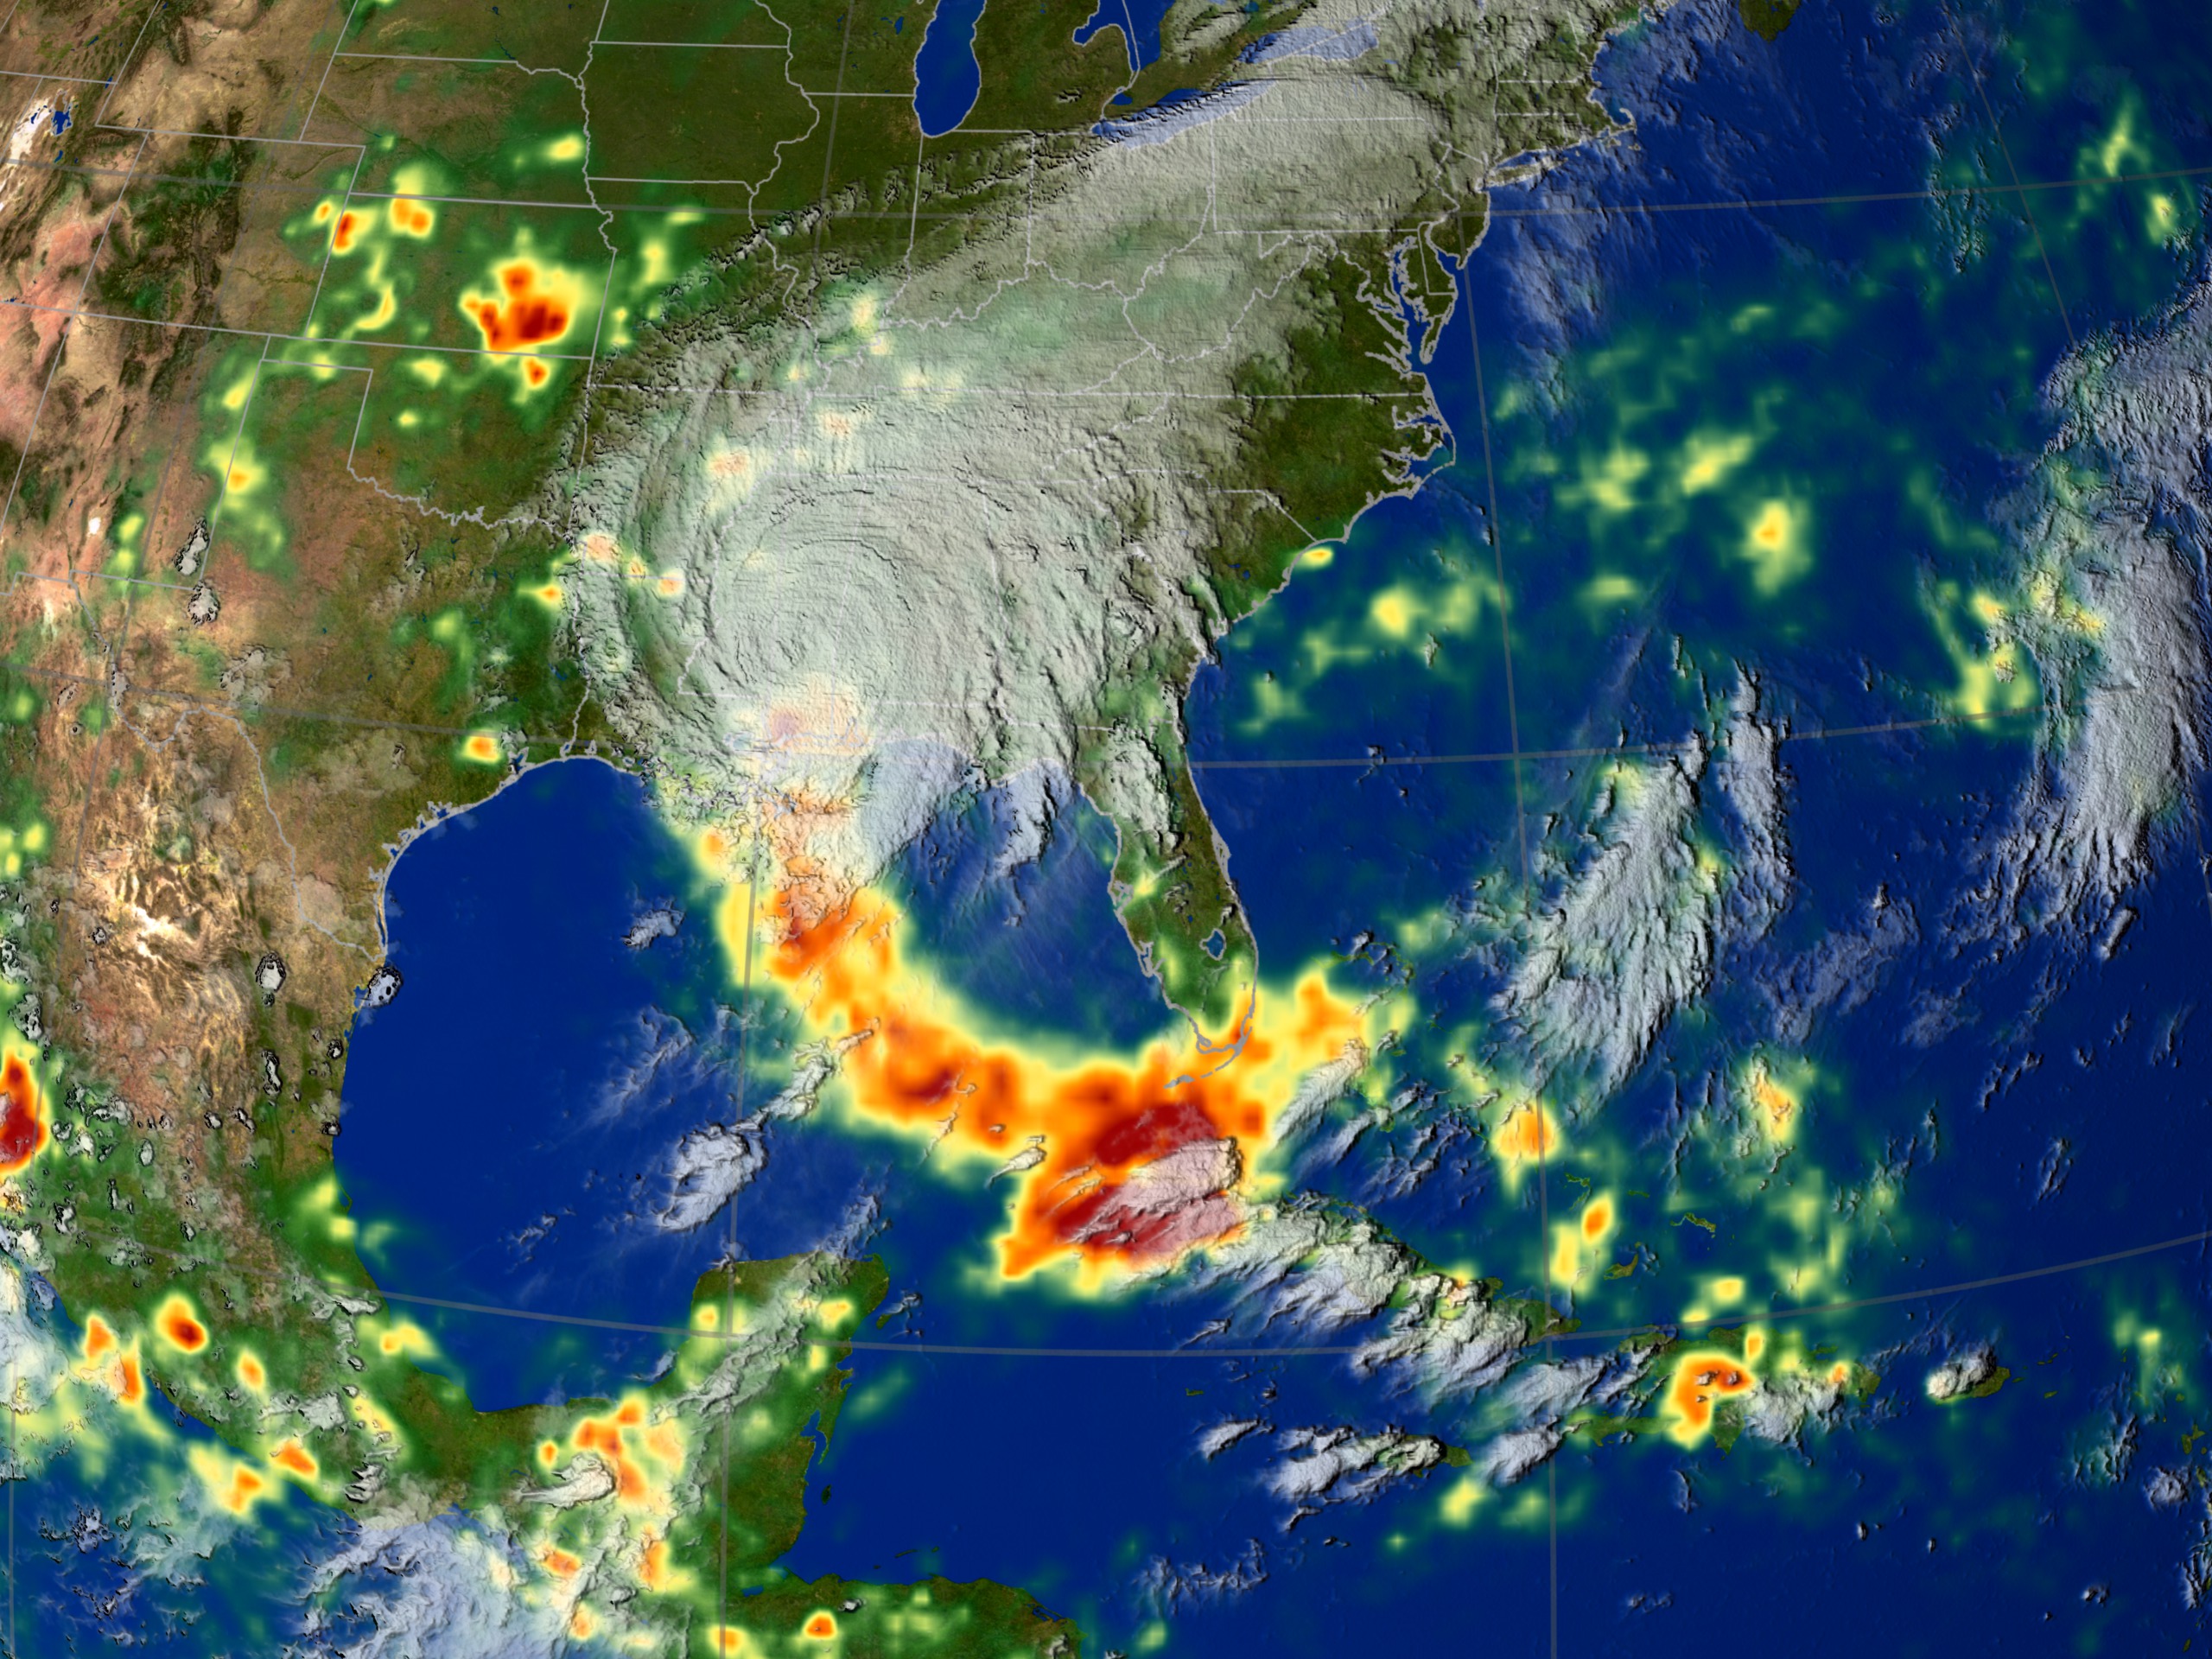
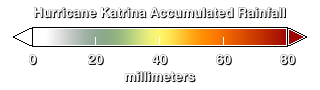
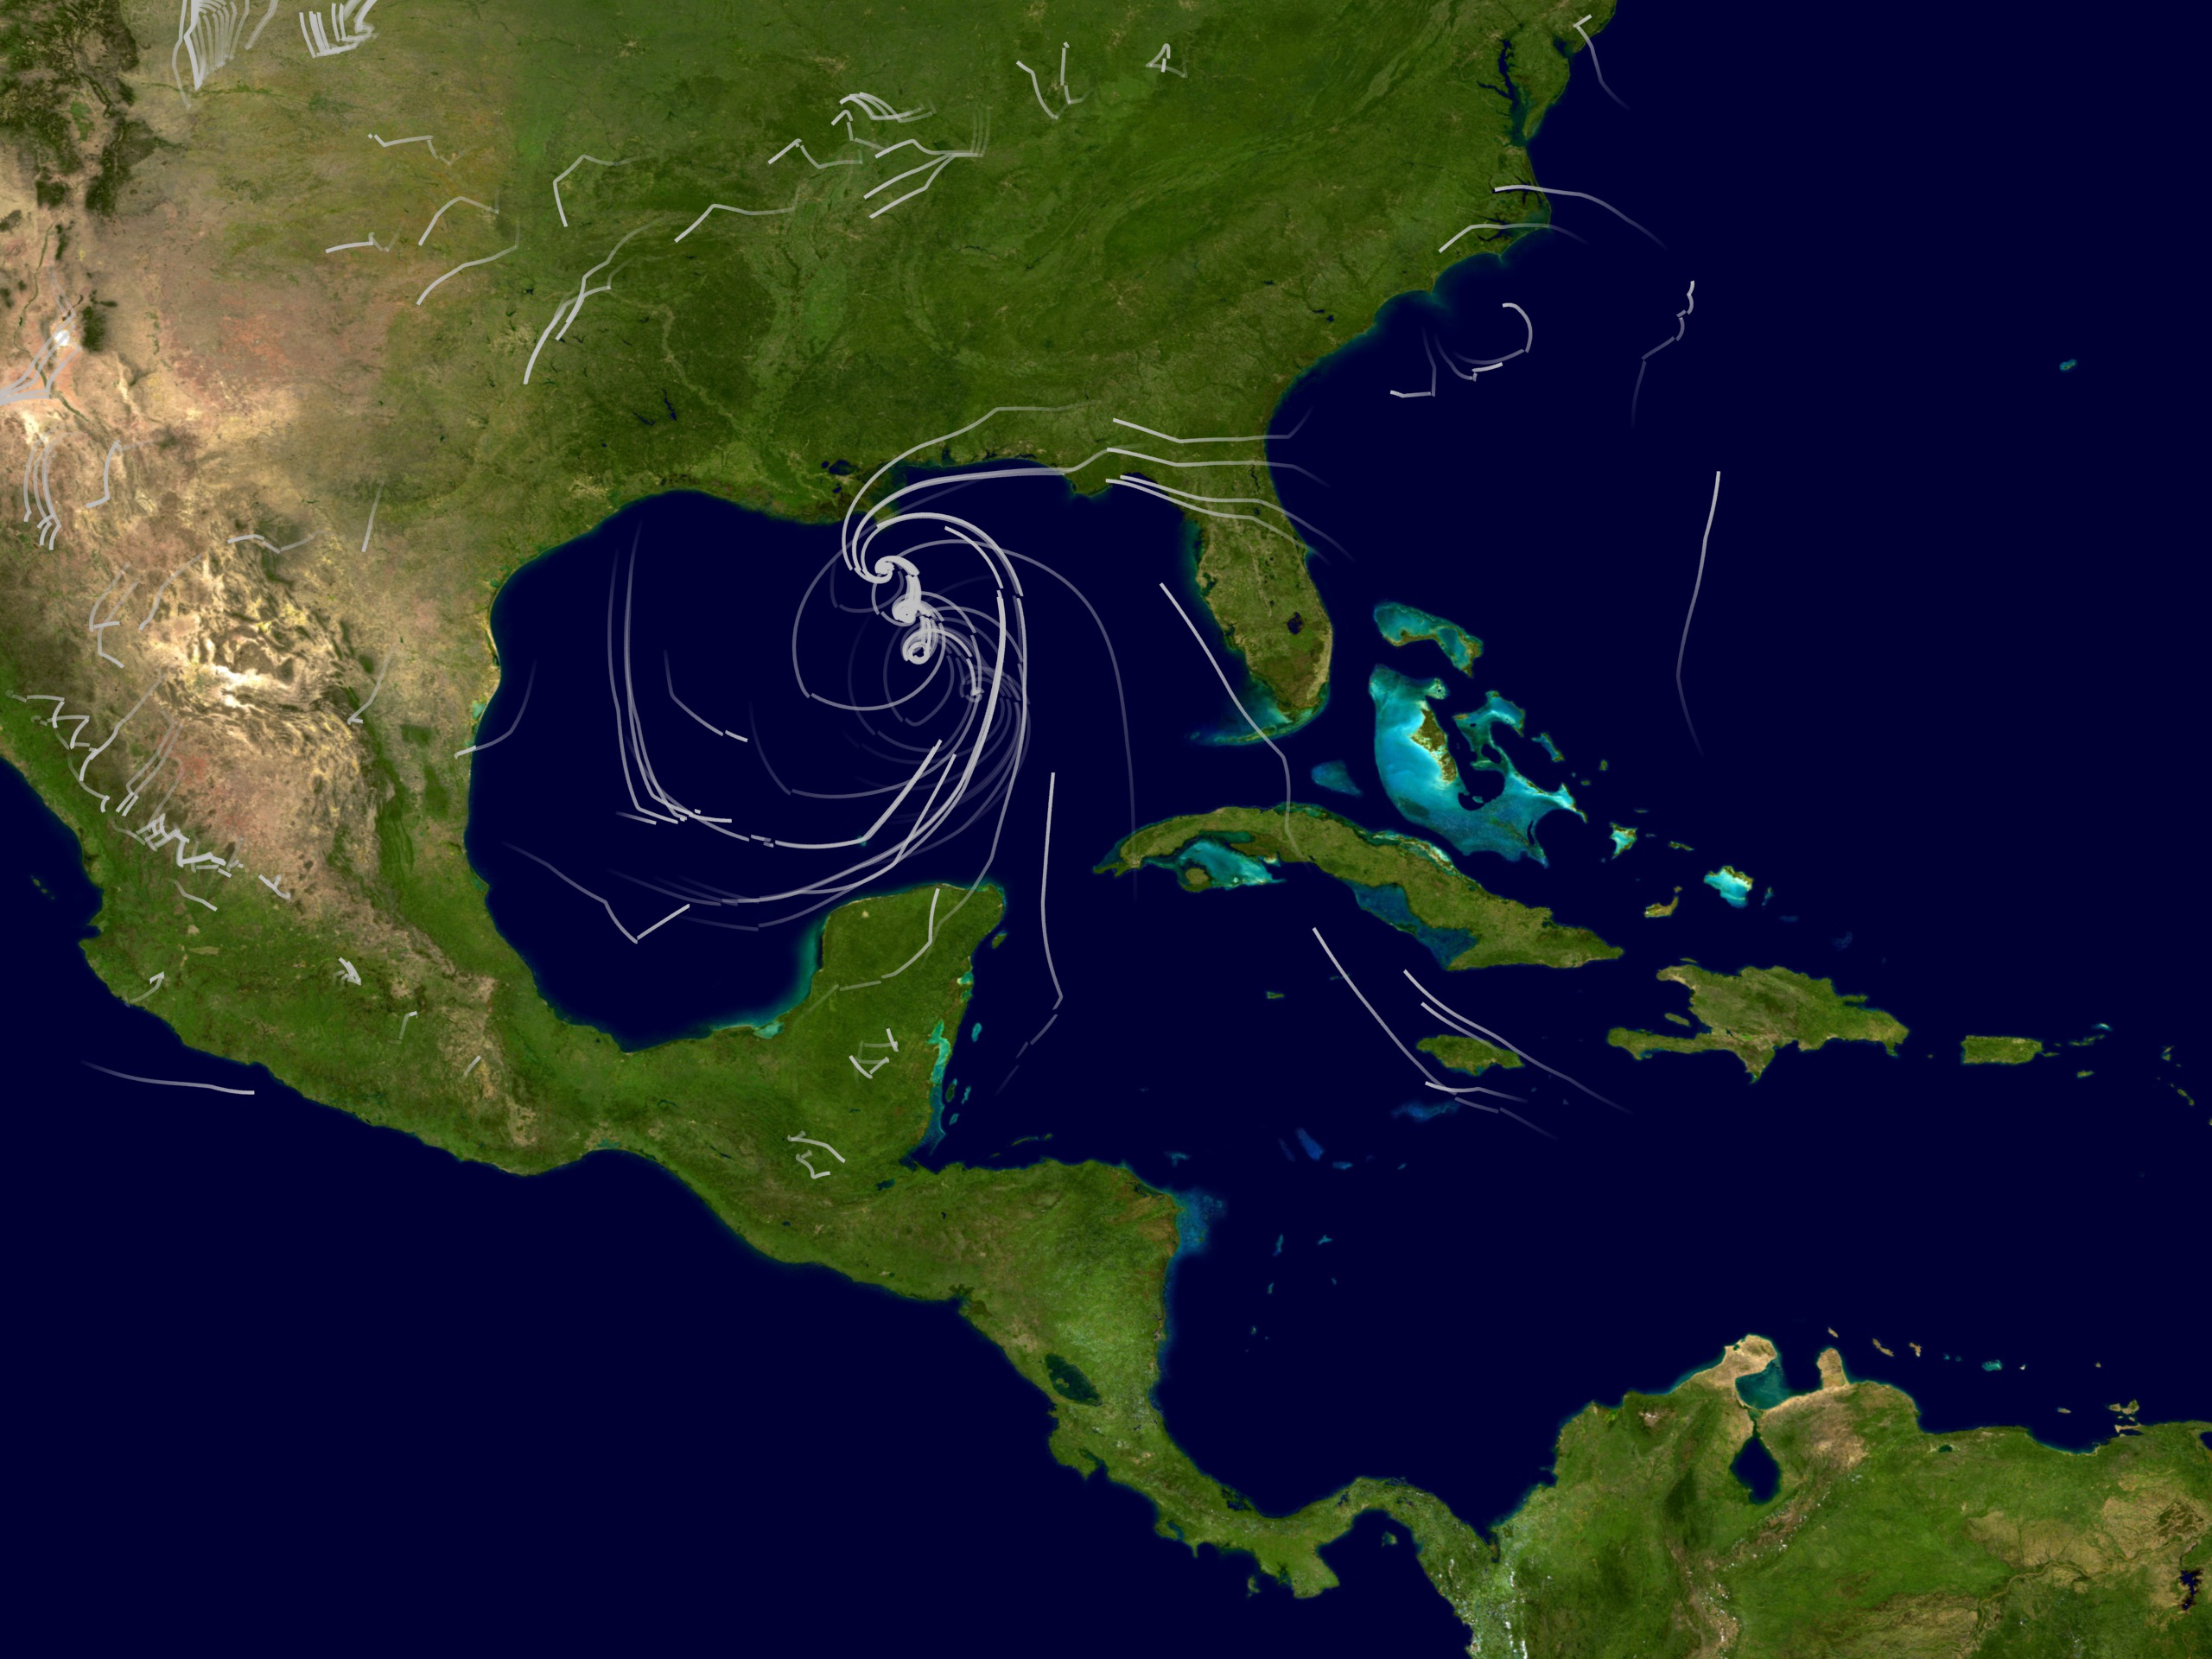
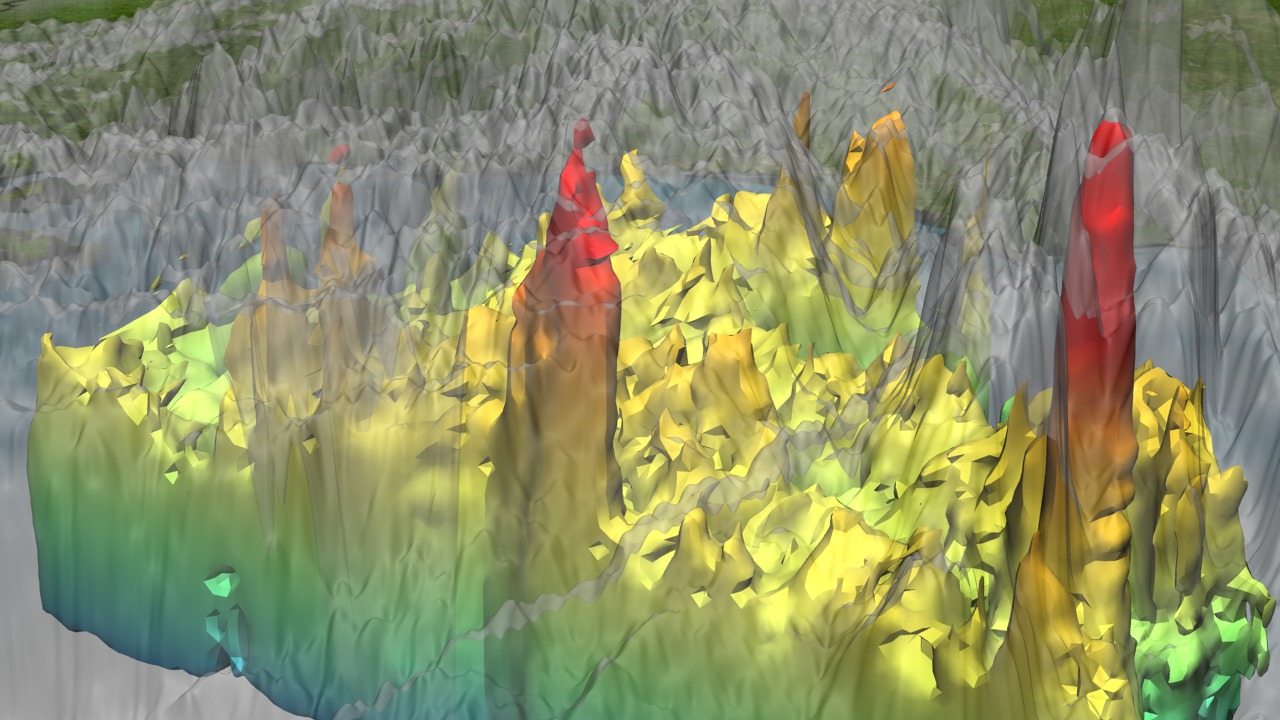
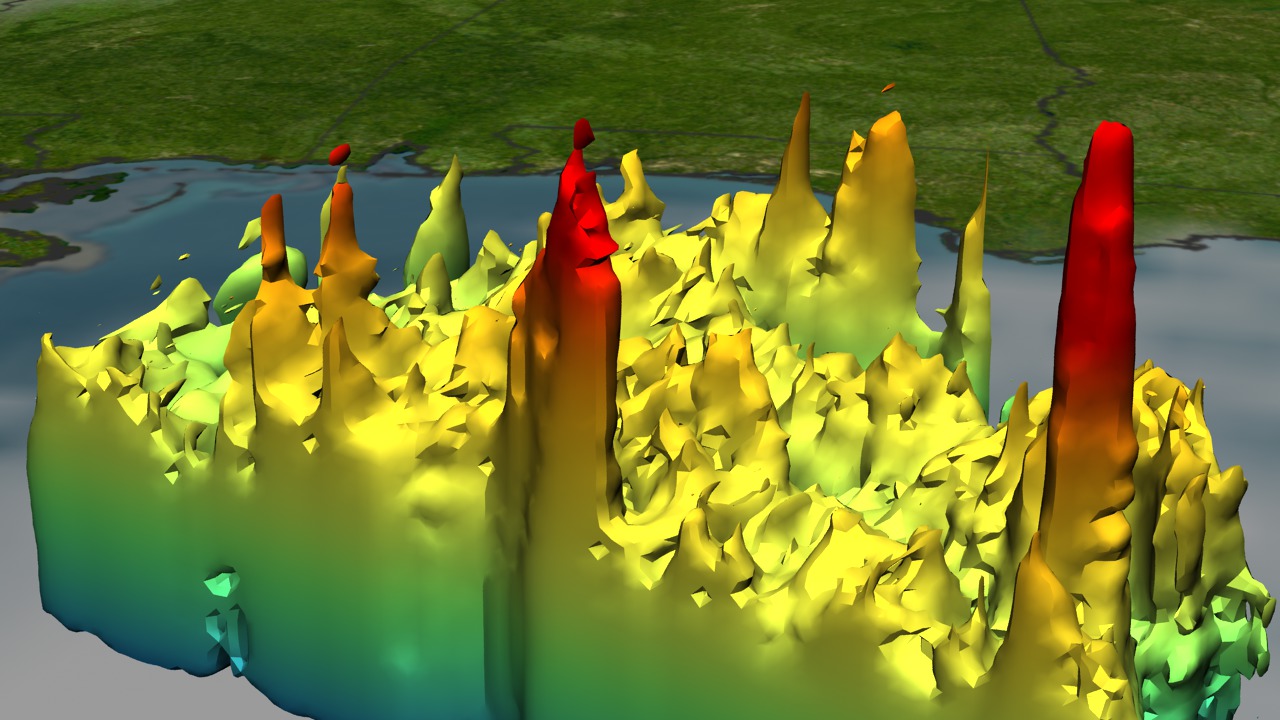
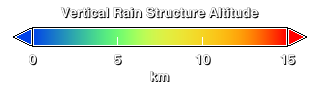
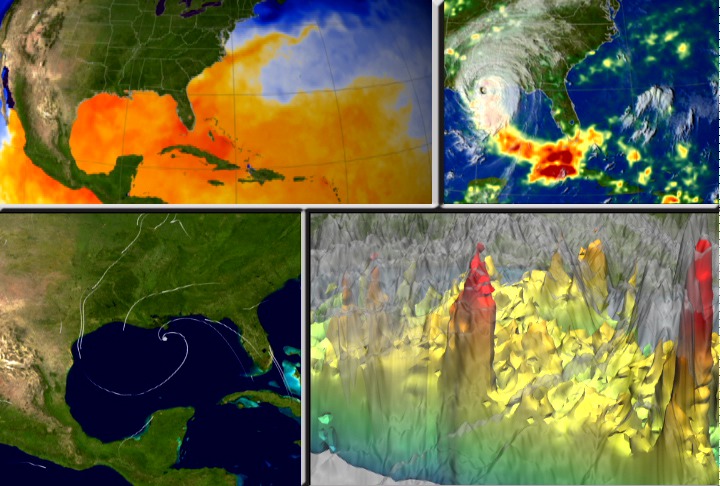
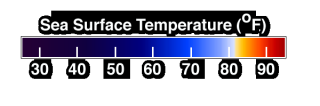
The top left window shows sea surface temperature and clouds. Orange and red colors represent ocean temperatures at 82 degrees Fahrenheit or higher. This is the temperature required for hurricanes to form. The bottom left window shows wind analysis model data from NASA's Modeling, Analysis, and Prediction (MAP '05) program. The top right window shows Rainfall Accumulation for Hurricane Katrina from the TRMM spacecraft. The bottom right window shows Energy-releasing deep convective clouds (to 16 km) in the eyewall of Hurricane Katrina, called 'Hot Towers', on August 28 occurred while the storm was intensifying to a category 5 classification.
NASA Scientists Research Tropical Cyclones
The top left window shows sea surface temperature and clouds. Orange and red colors represent ocean temperatures at 82 degrees Fahrenheit or higher. This is the temperature required for hurricanes to form. The bottom left window shows wind analysis model data from NASA's Modeling, Analysis, and Prediction (MAP '05) program. The top right window shows Rainfall Accumulation for Hurricane Katrina from the TRMM spacecraft. The bottom right window shows Energy-releasing deep convective clouds (to 16 km) in the eyewall of Hurricane Katrina, called 'Hot Towers', on August 28 occurred while the storm was intensifying to a category 5 classification.
Visualization Credits
Lori Perkins (NASA/GSFC): Lead Animator
Stuart A. Snodgrass (GST): Animator
Greg Shirah (NASA/GSFC): Animator
Fred Kemman (HTSI): Animator
David Adamec (NASA/GSFC): Scientist
Scott Braun (NASA/GSFC): Scientist
Sarah DeWitt (NASA/GSFC): Writer
Stuart A. Snodgrass (GST): Animator
Greg Shirah (NASA/GSFC): Animator
Fred Kemman (HTSI): Animator
David Adamec (NASA/GSFC): Scientist
Scott Braun (NASA/GSFC): Scientist
Sarah DeWitt (NASA/GSFC): Writer
Please give credit for this item to:
NASA/Goddard Space Flight Center Scientific Visualization Studio
NASA/Goddard Space Flight Center Scientific Visualization Studio
Short URL to share this page:
https://svs.gsfc.nasa.gov/3362
Mission:
Tropical Rainfall Measuring Mission - TRMM
Data Used:
Note: While we identify the data sets used in these visualizations, we do not store any further details nor the data sets themselves on our site.
This item is part of this series:
Hurricane Katrina
Goddard TV Tape:
G2005-005B
Keywords:
DLESE >> Atmospheric science
DLESE >> Natural hazards
GCMD >> Earth Science >> Atmosphere >> Atmospheric Phenomena >> Hurricanes
GCMD >> Earth Science >> Human Dimensions >> Natural Hazards >> Meteorological Hazards
SVS >> Hurricane Forecasting
NASA Science >> Earth
GCMD keywords can be found on the Internet with the following citation: Olsen, L.M., G. Major, K. Shein, J. Scialdone, S. Ritz, T. Stevens, M. Morahan, A. Aleman, R. Vogel, S. Leicester, H. Weir, M. Meaux, S. Grebas, C.Solomon, M. Holland, T. Northcutt, R. A. Restrepo, R. Bilodeau, 2013. NASA/Global Change Master Directory (GCMD) Earth Science Keywords. Version 8.0.0.0.0
https://svs.gsfc.nasa.gov/3362
Mission:
Tropical Rainfall Measuring Mission - TRMM
Data Used:
Aqua/AMSR-E
2005/08/23 - 2005/08/31
For more information, please click http://wwwghcc.msfc.nasa.gov/AMSR/
TRMM/VIRS
2005/08/23 - 2005/08/31TRMM and DMSP/SSM/I and TMI/3B4XRT also referred to as: 3-hour Rainmap
2005/08/23 - 2005/08/31GEOS-DAS
Model - NASA/GSFC GMAO - 2005/08/23 - 2005/08/31
Goddard EOS Data Assimilation System
This item is part of this series:
Hurricane Katrina
Goddard TV Tape:
G2005-005B
Keywords:
DLESE >> Atmospheric science
DLESE >> Natural hazards
GCMD >> Earth Science >> Atmosphere >> Atmospheric Phenomena >> Hurricanes
GCMD >> Earth Science >> Human Dimensions >> Natural Hazards >> Meteorological Hazards
SVS >> Hurricane Forecasting
NASA Science >> Earth
GCMD keywords can be found on the Internet with the following citation: Olsen, L.M., G. Major, K. Shein, J. Scialdone, S. Ritz, T. Stevens, M. Morahan, A. Aleman, R. Vogel, S. Leicester, H. Weir, M. Meaux, S. Grebas, C.Solomon, M. Holland, T. Northcutt, R. A. Restrepo, R. Bilodeau, 2013. NASA/Global Change Master Directory (GCMD) Earth Science Keywords. Version 8.0.0.0.0


