Earth
ID: 3345
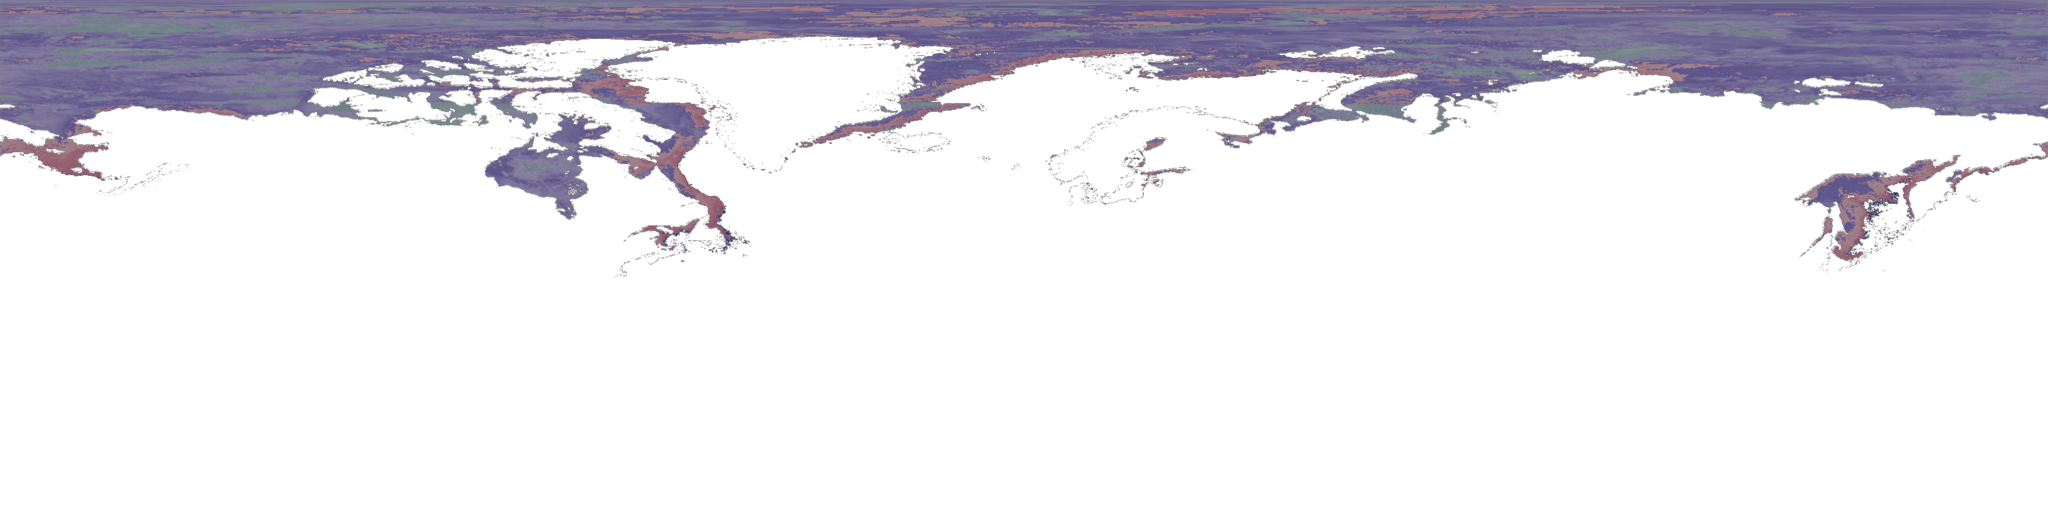
This animation shows the daily sea ice surface temperature over the northern hemisphere from September 2002 through May 2003. The sea ice surface temperature was measured by the MODIS instrument on the Aqua satellite. Since this instrument cannot take measurements through clouds, in cloud-covered regions or areas with suspect data quality, previous values are retained until valid data is obtained. The satellite instruments are also unable to collect data in the dark, so the data values in polar darkness are not updated during the winter until the sun moves northwards in the spring. The color of the sea ice depicts the sea ice surface temperature.

Sea Ice Surface Temperature with Alternate Color Scale (WMS)
Visualization Credits
Please give credit for this item to:
NASA/Goddard Space Flight Center Scientific Visualization Studio
NASA/Goddard Space Flight Center Scientific Visualization Studio
Short URL to share this page:
https://svs.gsfc.nasa.gov/3345
Data Used:
Note: While we identify the data sets used in these visualizations, we do not store any further details nor the data sets themselves on our site.
Dates of Data Used:
2002-9-1 to 2003-5-31
Keywords:
DLESE >> Cryology
GCMD >> Earth Science >> Cryosphere >> Sea Ice >> Ice Temperature
SVS >> Sea Ice Surface Temperature
NASA Science >> Earth
GCMD keywords can be found on the Internet with the following citation: Olsen, L.M., G. Major, K. Shein, J. Scialdone, S. Ritz, T. Stevens, M. Morahan, A. Aleman, R. Vogel, S. Leicester, H. Weir, M. Meaux, S. Grebas, C.Solomon, M. Holland, T. Northcutt, R. A. Restrepo, R. Bilodeau, 2013. NASA/Global Change Master Directory (GCMD) Earth Science Keywords. Version 8.0.0.0.0
https://svs.gsfc.nasa.gov/3345
Data Used:
Aqua/MODIS/Sea Surface Temperature
2002-9-1 to 2003-5-31Dates of Data Used:
2002-9-1 to 2003-5-31
Keywords:
DLESE >> Cryology
GCMD >> Earth Science >> Cryosphere >> Sea Ice >> Ice Temperature
SVS >> Sea Ice Surface Temperature
NASA Science >> Earth
GCMD keywords can be found on the Internet with the following citation: Olsen, L.M., G. Major, K. Shein, J. Scialdone, S. Ritz, T. Stevens, M. Morahan, A. Aleman, R. Vogel, S. Leicester, H. Weir, M. Meaux, S. Grebas, C.Solomon, M. Holland, T. Northcutt, R. A. Restrepo, R. Bilodeau, 2013. NASA/Global Change Master Directory (GCMD) Earth Science Keywords. Version 8.0.0.0.0


