Earth
ID: 3307
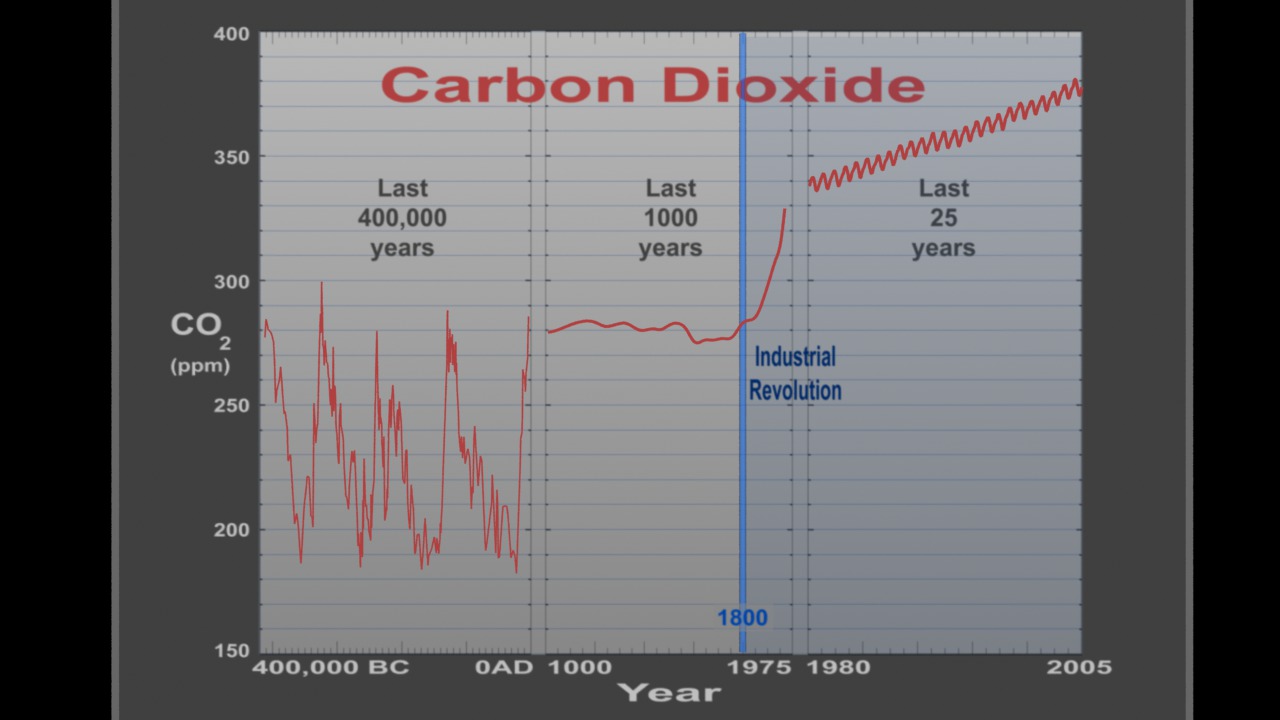
The animation shows a graph of carbon dioxide (on the y-axis) versus time (on the x-axis). First data is shown from about the last 400,000 years. Next, this graph slides to the left and a new graph slides on showing carbon dioxide from the last 1000 years. NOTE: the y-axis scale remains the same. Finally, a graph showing carbon dioxide from 1980 to 2005 is shown. The industrial revolution is shown as a blue line. Lake Vostok ice cores provide data from about 400,000 BC to about 4000 BC; Law Dome ice cores provide data from 1010 AD to 1975 AD; Mauna Loa observations provide data from 1980 to 2005.
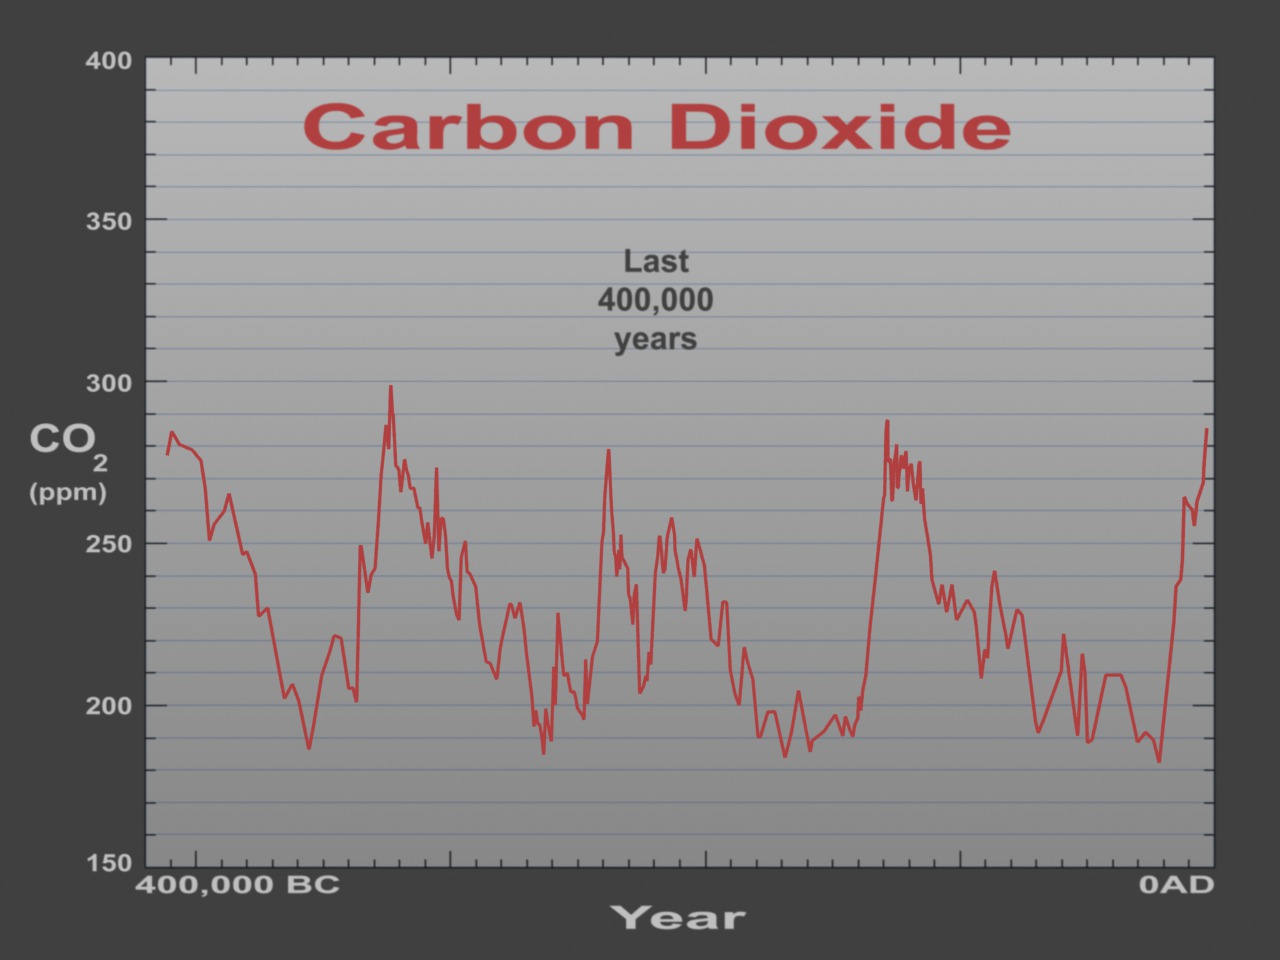
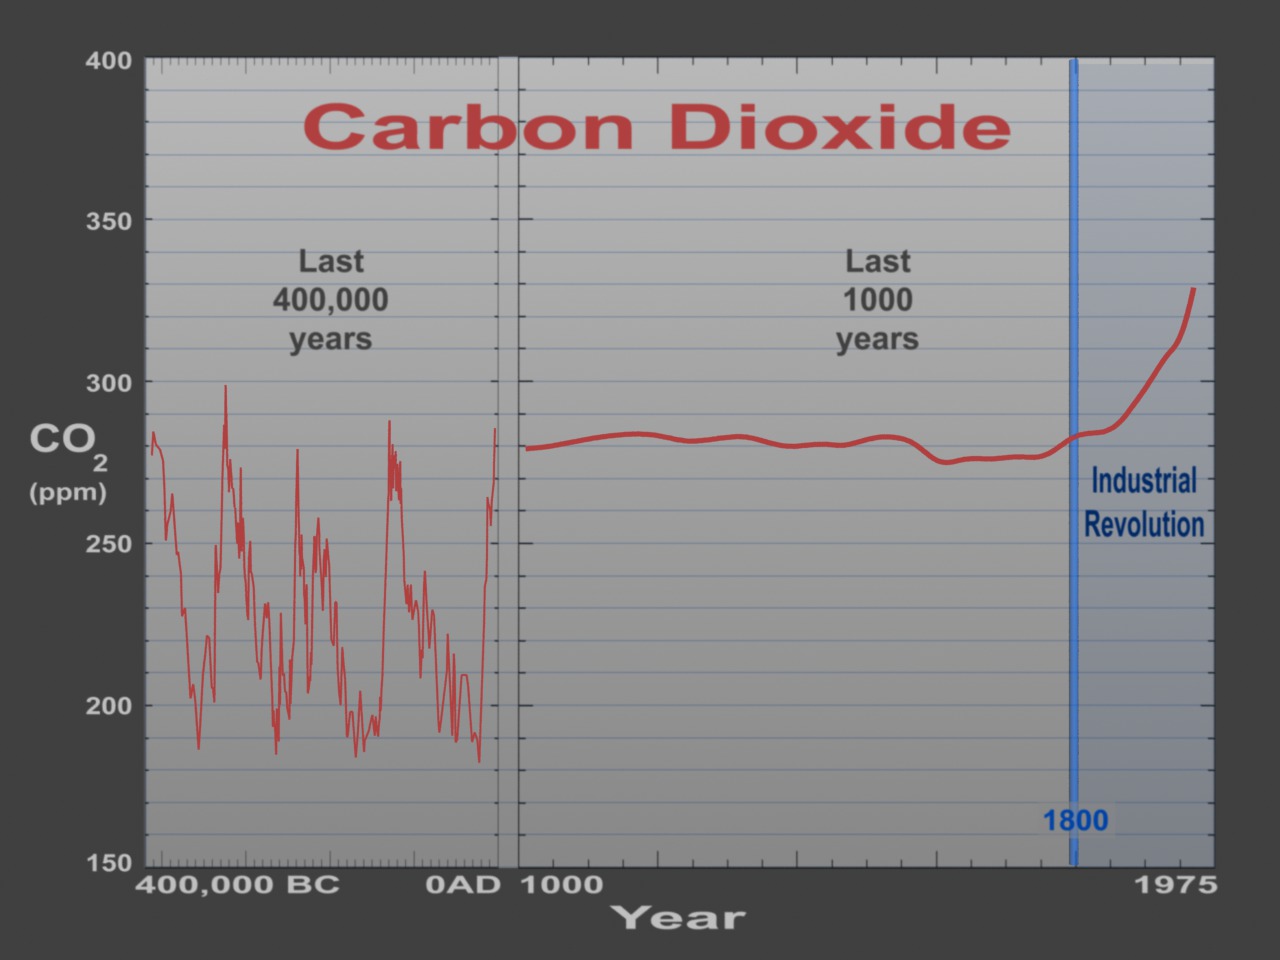
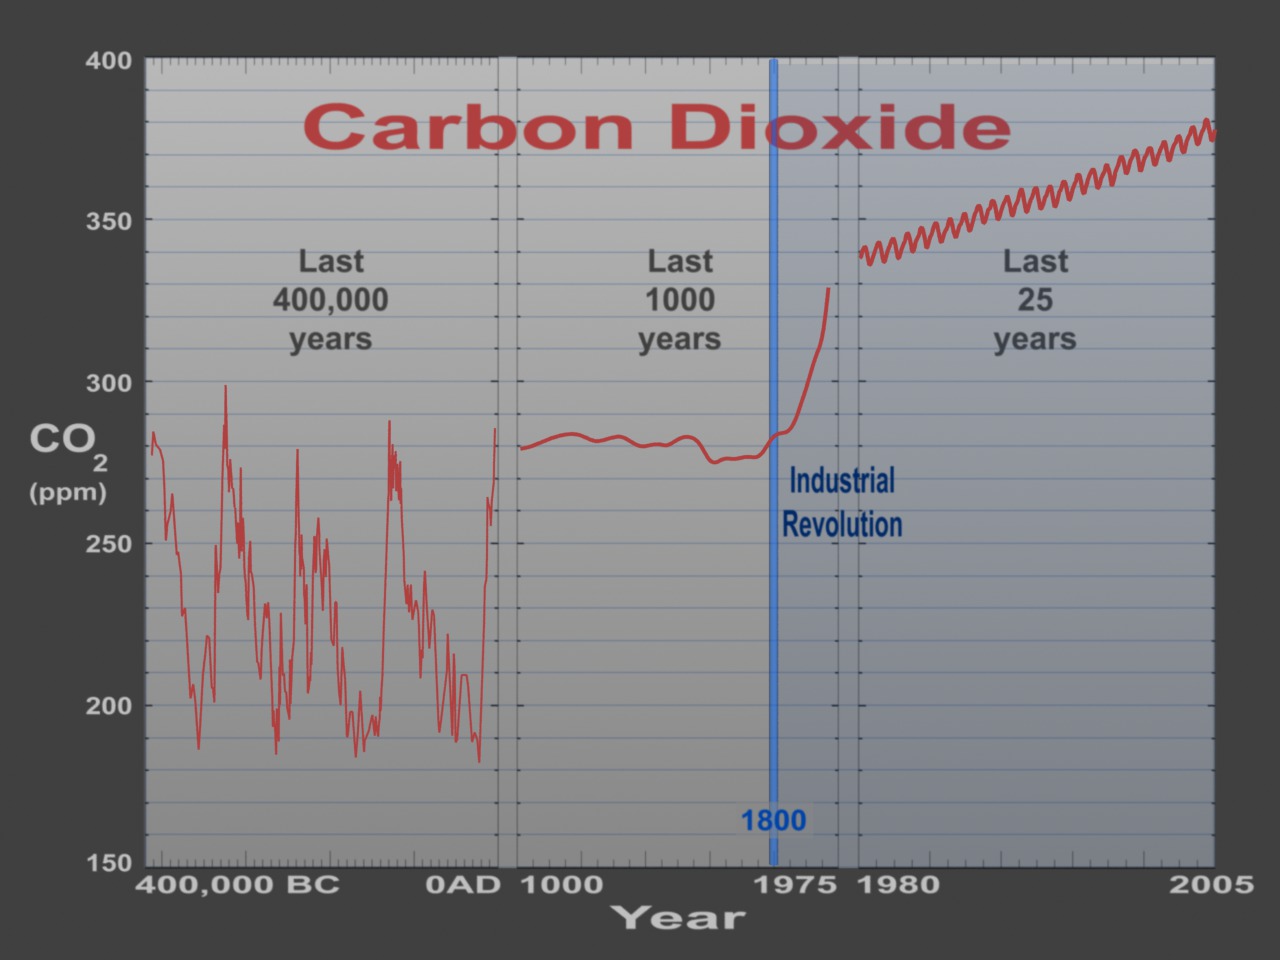
Missing Carbon: CO2 Growth in the last 400,000 Years
Visualization Credits
Please give credit for this item to:
NASA/Goddard Space Flight Center Scientific Visualization Studio
NASA/Goddard Space Flight Center Scientific Visualization Studio
Short URL to share this page:
https://svs.gsfc.nasa.gov/3307
Data Used:
Note: While we identify the data sets used in these visualizations, we do not store any further details nor the data sets themselves on our site.
This item is part of this series:
Missing Carbon
Goddard TV Tape:
G2007-001HD -- NASA's HD Climate Change Resource Tape
Keywords:
SVS >> HDTV
GCMD >> Earth Science >> Atmosphere >> Atmospheric Chemistry/Carbon and Hydrocarbon Compounds >> Carbon Dioxide
GCMD >> Earth Science >> Paleoclimate >> Ice Core Records >> Carbon Dioxide
SVS >> Copenhagen
NASA Science >> Earth
GCMD keywords can be found on the Internet with the following citation: Olsen, L.M., G. Major, K. Shein, J. Scialdone, S. Ritz, T. Stevens, M. Morahan, A. Aleman, R. Vogel, S. Leicester, H. Weir, M. Meaux, S. Grebas, C.Solomon, M. Holland, T. Northcutt, R. A. Restrepo, R. Bilodeau, 2013. NASA/Global Change Master Directory (GCMD) Earth Science Keywords. Version 8.0.0.0.0
https://svs.gsfc.nasa.gov/3307
Data Used:
Carbon Dioxide from Lake Vostok Ice Core
411,005 BC to 3674 BCCarbon Dioxide from Lawdome Ice Core
1010 AD to 1975 ADCarbon Dioxide from Mauna Loa Measurements
1980 to 2005This item is part of this series:
Missing Carbon
Goddard TV Tape:
G2007-001HD -- NASA's HD Climate Change Resource Tape
Keywords:
SVS >> HDTV
GCMD >> Earth Science >> Atmosphere >> Atmospheric Chemistry/Carbon and Hydrocarbon Compounds >> Carbon Dioxide
GCMD >> Earth Science >> Paleoclimate >> Ice Core Records >> Carbon Dioxide
SVS >> Copenhagen
NASA Science >> Earth
GCMD keywords can be found on the Internet with the following citation: Olsen, L.M., G. Major, K. Shein, J. Scialdone, S. Ritz, T. Stevens, M. Morahan, A. Aleman, R. Vogel, S. Leicester, H. Weir, M. Meaux, S. Grebas, C.Solomon, M. Holland, T. Northcutt, R. A. Restrepo, R. Bilodeau, 2013. NASA/Global Change Master Directory (GCMD) Earth Science Keywords. Version 8.0.0.0.0


