Earth
ID: 3268
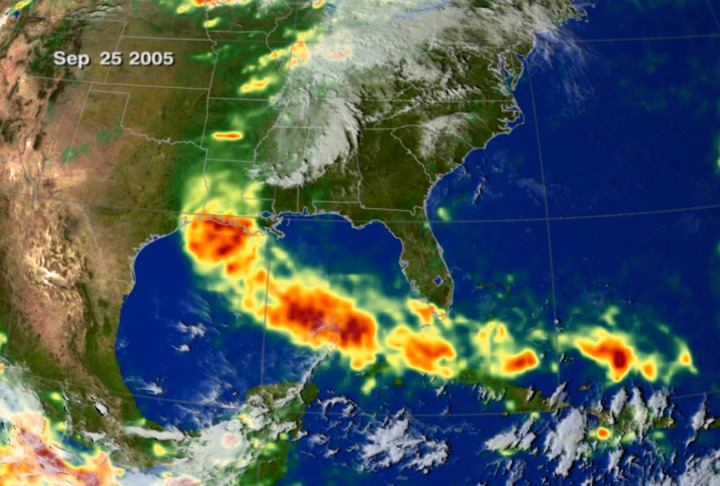
This animation shows rain accumulation from Hurricane Rita from September 18 through 25, 2005 based on data from the Tropical Rainfall Measuring Mission (TRMM) Multisatellite Precipitation Analysis. Satellite cloud data from NOAA/GOES is overlaid for context. The accumulation is shown in colors ranging from green (less than 30 mm of rain) through red (80 mm or more). The TRMM satellite, using the world's only spaceborne rain radar and other microwave instruments, measures rainfall over the ocean.
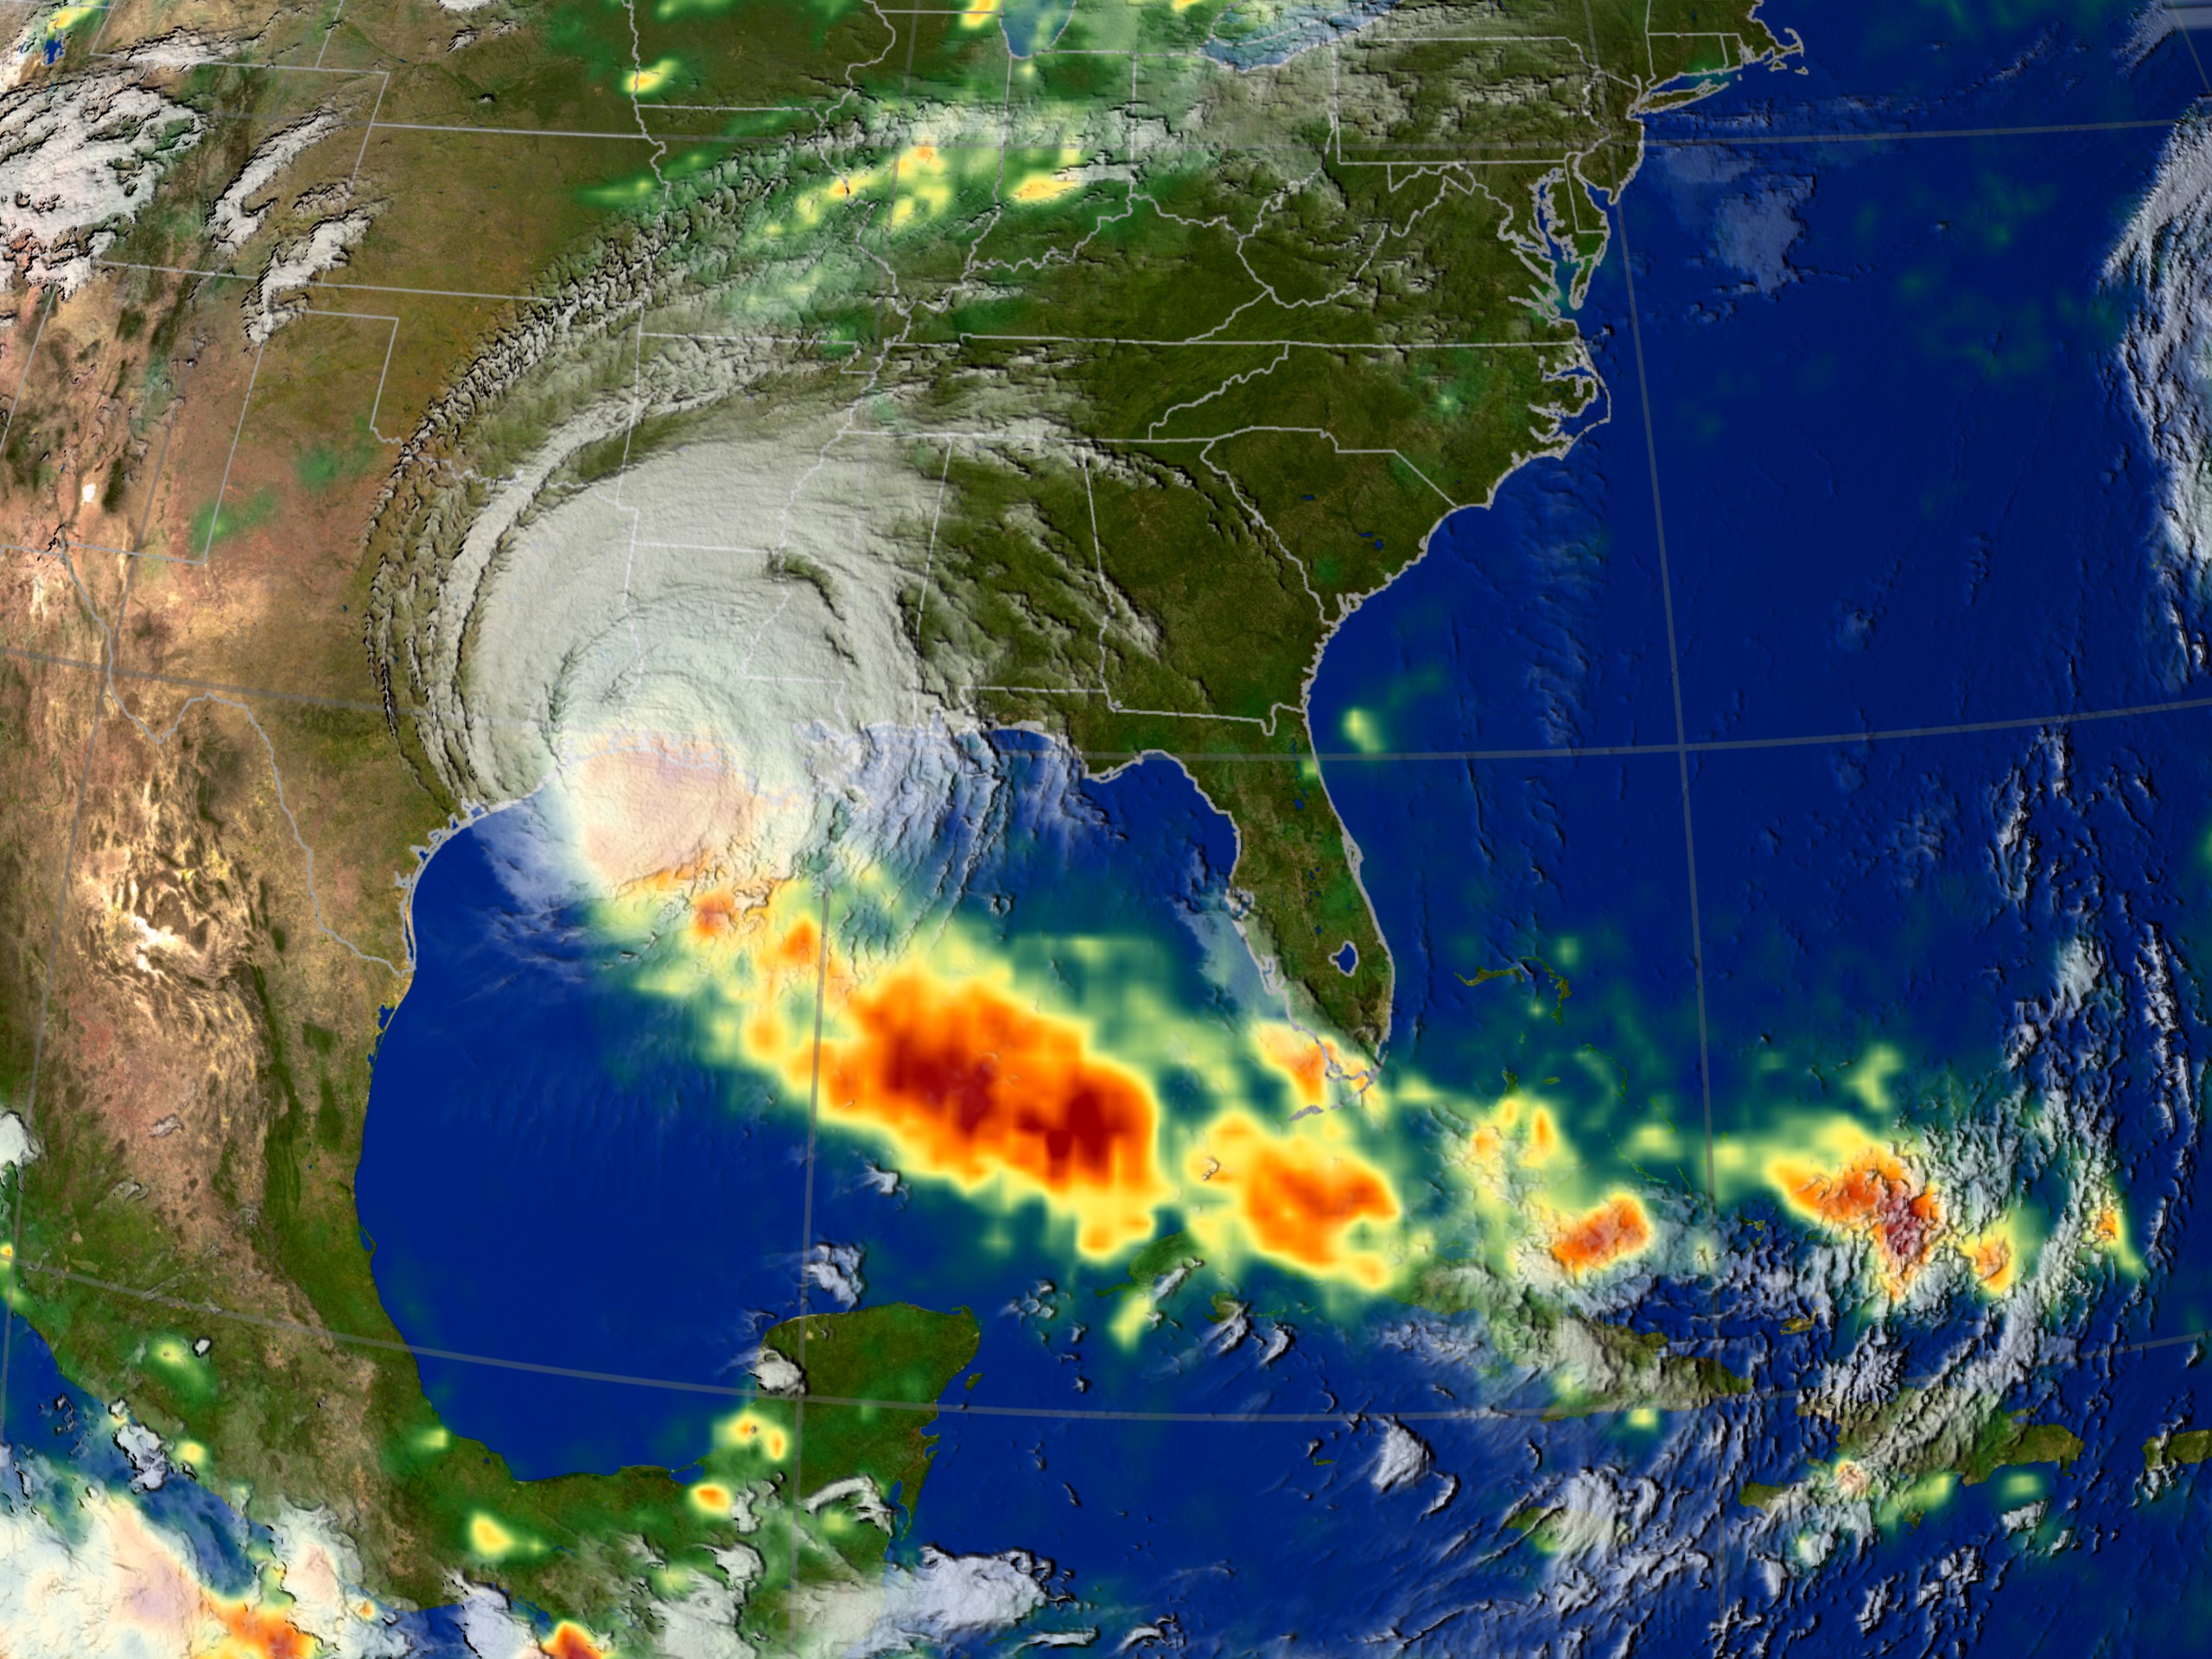
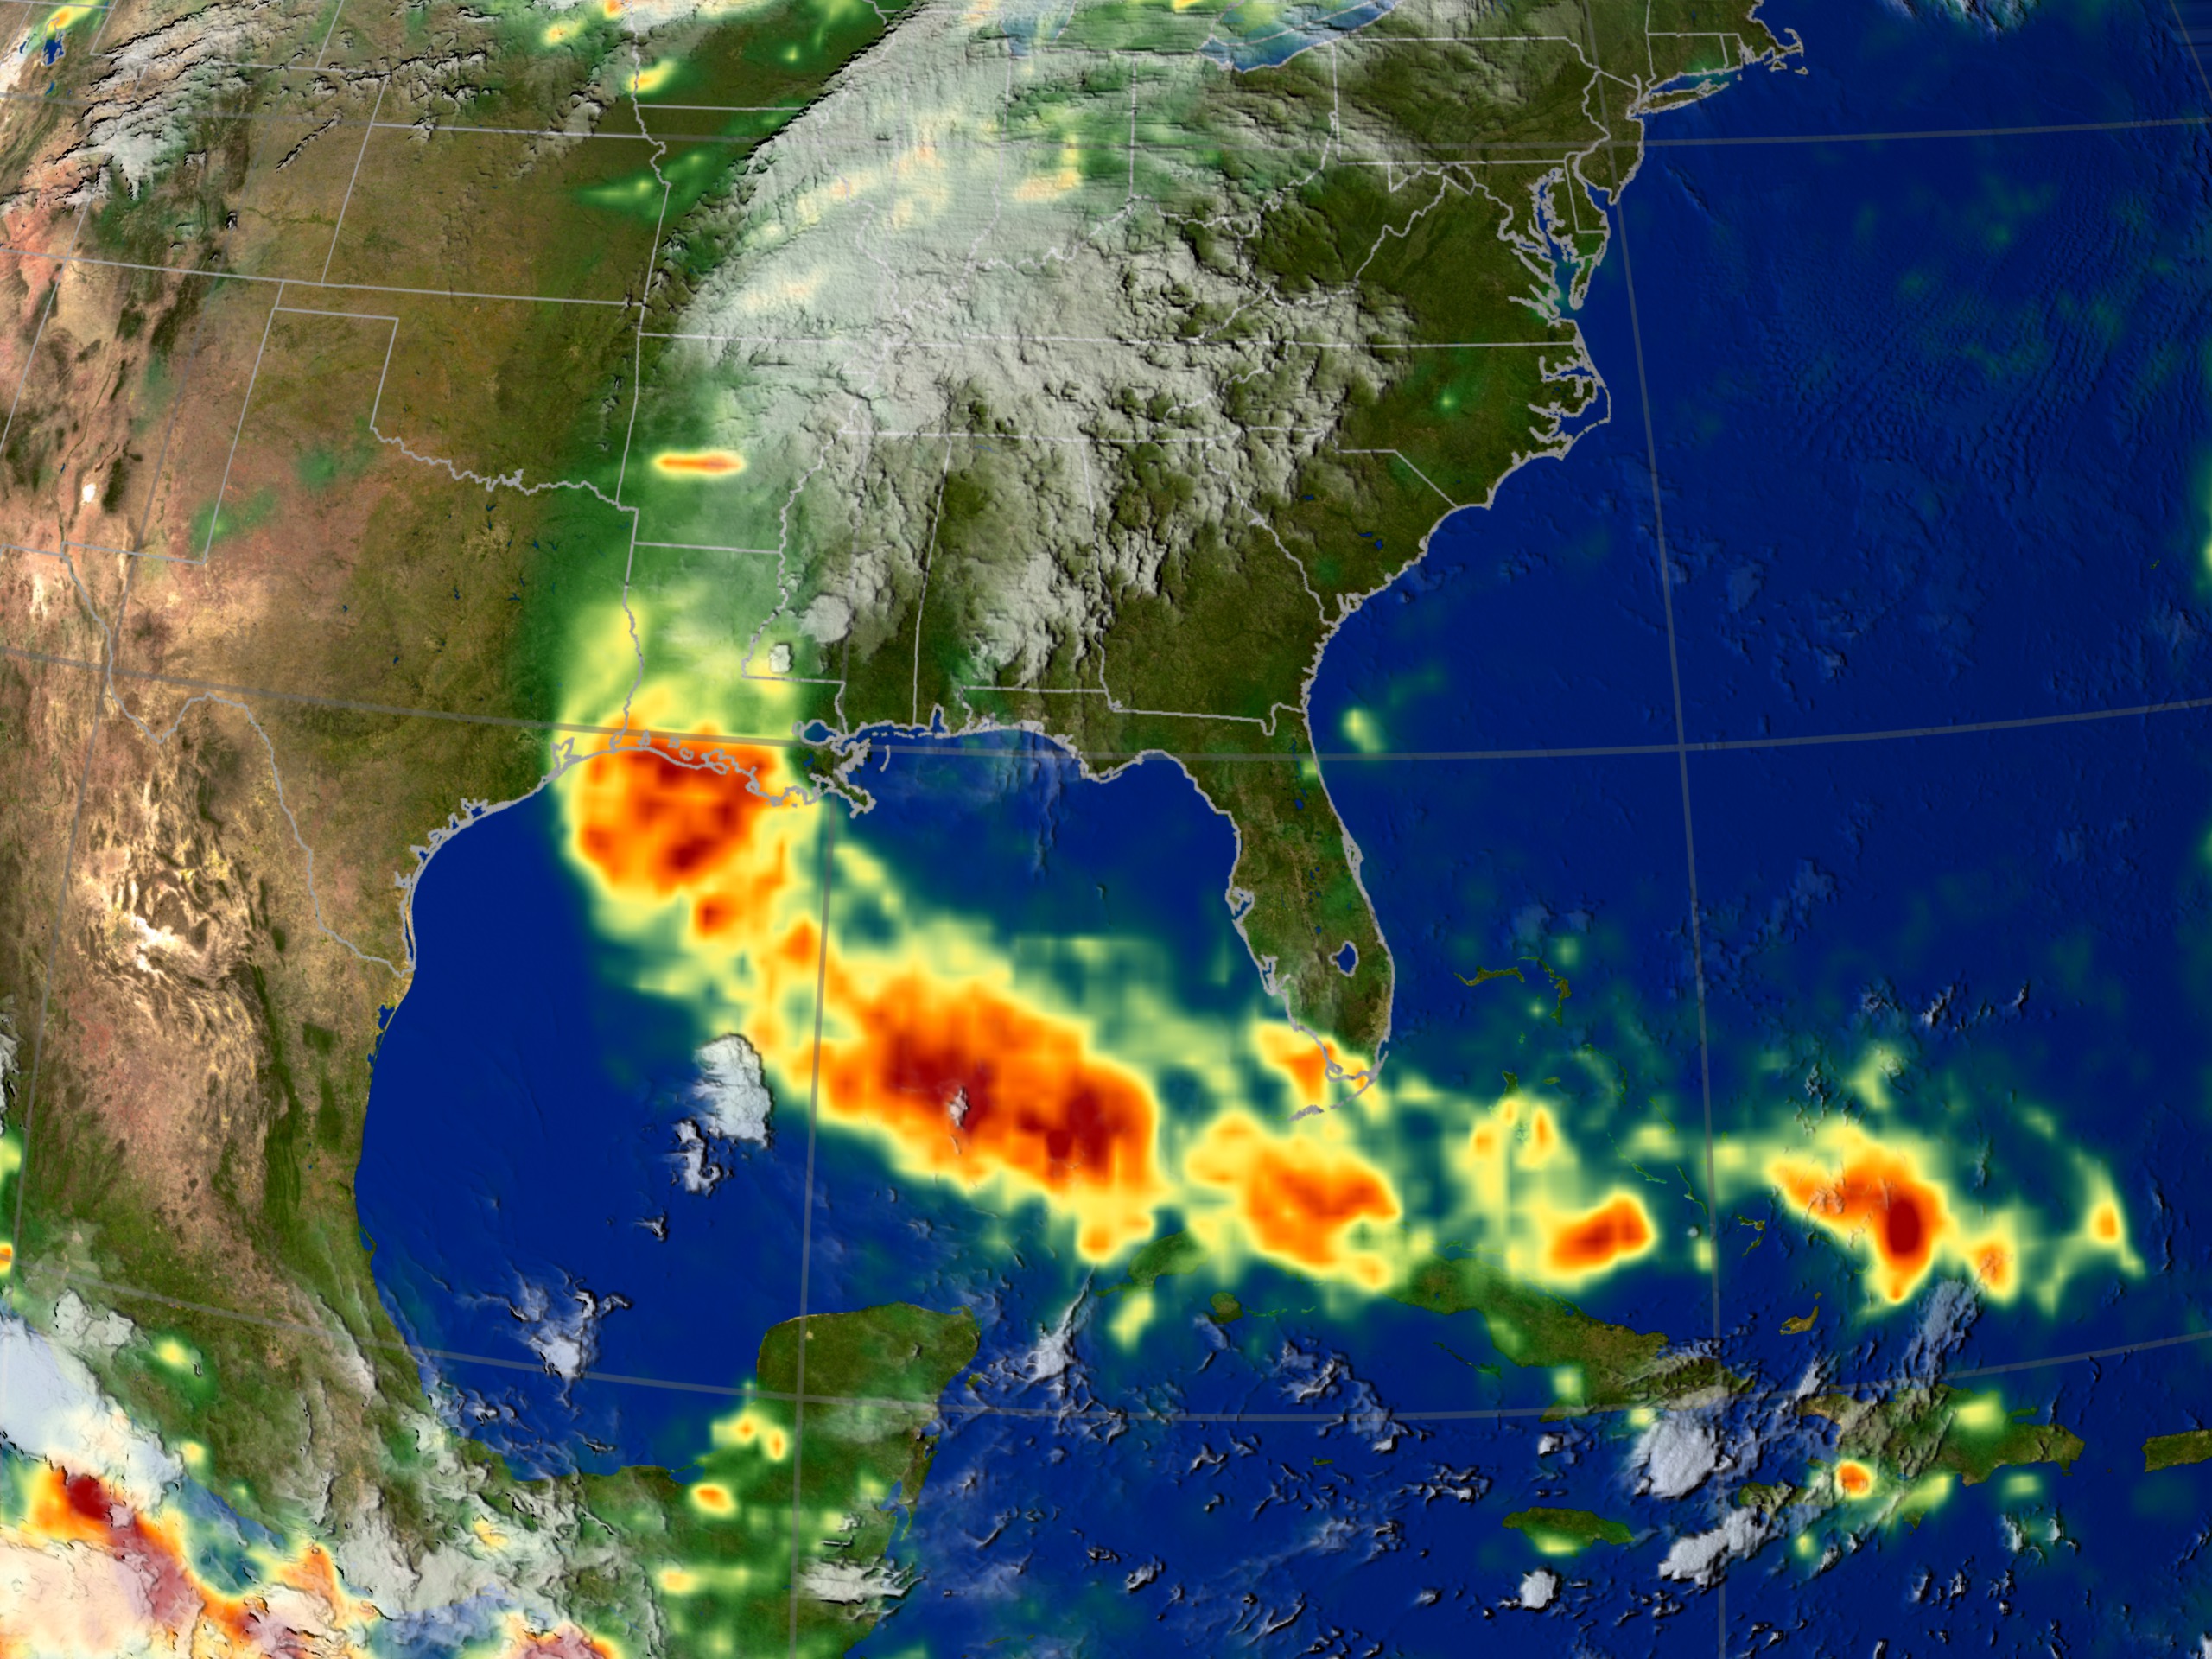

Hurricane Rita Rain Accumulation
Visualization Credits
Greg Shirah (NASA/GSFC): Lead Animator
Lori Perkins (NASA/GSFC): Animator
Alex Kekesi (Global Science and Technology, Inc.): Animator
Jeff Halverson (JCET UMBC): Scientist
J. Marshall Shepherd (NASA/GSFC): Scientist
Lori Perkins (NASA/GSFC): Animator
Alex Kekesi (Global Science and Technology, Inc.): Animator
Jeff Halverson (JCET UMBC): Scientist
J. Marshall Shepherd (NASA/GSFC): Scientist
Please give credit for this item to:
NASA/Goddard Space Flight Center Scientific Visualization Studio
NASA/Goddard Space Flight Center Scientific Visualization Studio
Short URL to share this page:
https://svs.gsfc.nasa.gov/3268
Missions:
Terra
Tropical Rainfall Measuring Mission - TRMM
Data Used:
Note: While we identify the data sets used in these visualizations, we do not store any further details nor the data sets themselves on our site.
This item is part of this series:
Hurricane Rita
Keywords:
DLESE >> Natural hazards
SVS >> Rainfall
GCMD >> Earth Science >> Atmosphere >> Clouds
GCMD >> Earth Science >> Atmosphere >> Clouds >> Cloud Amount/Frequency
SVS >> GOES
NASA Science >> Earth
GCMD keywords can be found on the Internet with the following citation: Olsen, L.M., G. Major, K. Shein, J. Scialdone, S. Ritz, T. Stevens, M. Morahan, A. Aleman, R. Vogel, S. Leicester, H. Weir, M. Meaux, S. Grebas, C.Solomon, M. Holland, T. Northcutt, R. A. Restrepo, R. Bilodeau, 2013. NASA/Global Change Master Directory (GCMD) Earth Science Keywords. Version 8.0.0.0.0
https://svs.gsfc.nasa.gov/3268
Missions:
Terra
Tropical Rainfall Measuring Mission - TRMM
Data Used:
TRMM and DMSP/SSM/I and TMI/3B4XRT also referred to as: 3-hour Rainmap
2005/09/18 - 2005/09/25Terra/MODIS/Blue Marble
Credit:
The Blue Marble data is courtesy of Reto Stockli (NASA/GSFC).
The Blue Marble data is courtesy of Reto Stockli (NASA/GSFC).
GOES-8/IR4
2005/09/18 - 2005/09/25Aqua/MODIS/Blue Marble
Credit:
The Blue Marble data is courtesy of Reto Stockli (NASA/GSFC).
The Blue Marble data is courtesy of Reto Stockli (NASA/GSFC).
This item is part of this series:
Hurricane Rita
Keywords:
DLESE >> Natural hazards
SVS >> Rainfall
GCMD >> Earth Science >> Atmosphere >> Clouds
GCMD >> Earth Science >> Atmosphere >> Clouds >> Cloud Amount/Frequency
SVS >> GOES
NASA Science >> Earth
GCMD keywords can be found on the Internet with the following citation: Olsen, L.M., G. Major, K. Shein, J. Scialdone, S. Ritz, T. Stevens, M. Morahan, A. Aleman, R. Vogel, S. Leicester, H. Weir, M. Meaux, S. Grebas, C.Solomon, M. Holland, T. Northcutt, R. A. Restrepo, R. Bilodeau, 2013. NASA/Global Change Master Directory (GCMD) Earth Science Keywords. Version 8.0.0.0.0


