Earth
ID: 3264
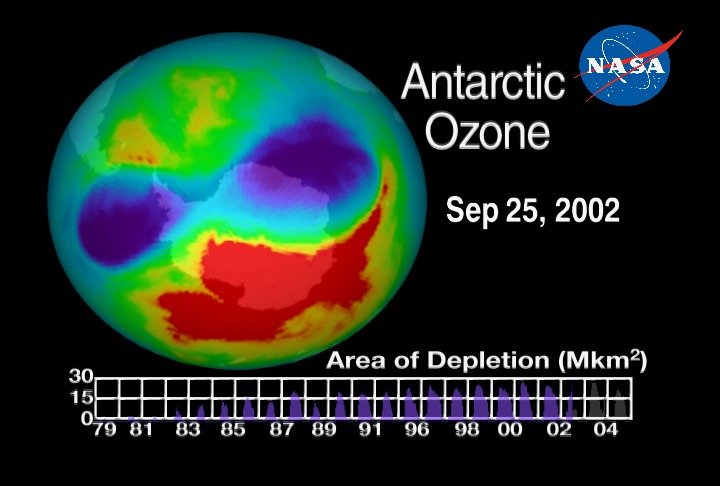
NASA has been monitoring the status of the ozone layer through satellite observations since the 1970s, beginning with the TOMS sensors on the Nimbus satellites. The latest-generation ozone-monitoring technology, the Ozone Monitoring Instrument (OMI), is flying onboard NASA's Aura satellite. The ozone hole is not technically a 'hole' where no ozone is present, but is actually a region of exceptionally depleted ozone in the stratosphere over the Antarctic. The ozone hole begins to grow in August and reaches its largest area in depth in the middle of September to early October period. In the early years (before 1984) the hole was small because chlorine and bromine levels over Antarctica were low. Year-to-year variations in area and depth are caused by year-to-year variations in temperature. Colder conditions result in a larger area and lower ozone values in the center of the hole. This animation shows total ozone in the Antarctic region along with the maximum ozone depth and size since the earliest measurements of Earth Probe instrument on the TOMS satellite. This animation was created for an exhibit at the Smithsonium Museum. Data dropouts have been removed for the following times: 1998/12/14-31, 2002/08/03-11, 2003/11/28-2003/12/02. The minimum ozone recorded is 82.0 du on September 26, 2003. The maximum area of 29 million square kilometers (11.4 million square miles) occurred on September 9, 2000.


Smithsonian Exhibit: Antarctic Ozone Sequence 1979 through 2004
Visualization Credits
Lori Perkins (NASA/GSFC): Lead Animator
Stuart A. Snodgrass (GST): Animator
Paul Newman (NASA/GSFC): Scientist
Ernest Hilsenrath (NASA/GSFC): Scientist
Richard McPeters (NASA/GSFC): Scientist
Stuart A. Snodgrass (GST): Animator
Paul Newman (NASA/GSFC): Scientist
Ernest Hilsenrath (NASA/GSFC): Scientist
Richard McPeters (NASA/GSFC): Scientist
Please give credit for this item to:
NASA/Goddard Space Flight Center Scientific Visualization Studio
NASA/Goddard Space Flight Center Scientific Visualization Studio
Short URL to share this page:
https://svs.gsfc.nasa.gov/3264
Data Used:
Note: While we identify the data sets used in these visualizations, we do not store any further details nor the data sets themselves on our site.
This item is part of this series:
Ozone
Keywords:
SVS >> Antarctic
DLESE >> Atmospheric science
SVS >> Ozone Hole
GCMD >> Earth Science >> Atmosphere >> Atmospheric Chemistry/Oxygen Compounds >> Ozone
NASA Science >> Earth
GCMD keywords can be found on the Internet with the following citation: Olsen, L.M., G. Major, K. Shein, J. Scialdone, S. Ritz, T. Stevens, M. Morahan, A. Aleman, R. Vogel, S. Leicester, H. Weir, M. Meaux, S. Grebas, C.Solomon, M. Holland, T. Northcutt, R. A. Restrepo, R. Bilodeau, 2013. NASA/Global Change Master Directory (GCMD) Earth Science Keywords. Version 8.0.0.0.0
https://svs.gsfc.nasa.gov/3264
Data Used:
Earth Probe/TOMS/Ozone Depth
1996/7/26 - 2004/12/31Earth Probe/TOMS/Ozone Size
1996/7/26 - 2004/12/31This item is part of this series:
Ozone
Keywords:
SVS >> Antarctic
DLESE >> Atmospheric science
SVS >> Ozone Hole
GCMD >> Earth Science >> Atmosphere >> Atmospheric Chemistry/Oxygen Compounds >> Ozone
NASA Science >> Earth
GCMD keywords can be found on the Internet with the following citation: Olsen, L.M., G. Major, K. Shein, J. Scialdone, S. Ritz, T. Stevens, M. Morahan, A. Aleman, R. Vogel, S. Leicester, H. Weir, M. Meaux, S. Grebas, C.Solomon, M. Holland, T. Northcutt, R. A. Restrepo, R. Bilodeau, 2013. NASA/Global Change Master Directory (GCMD) Earth Science Keywords. Version 8.0.0.0.0


