Earth
ID: 3182
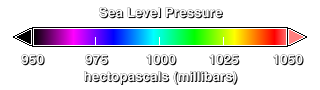
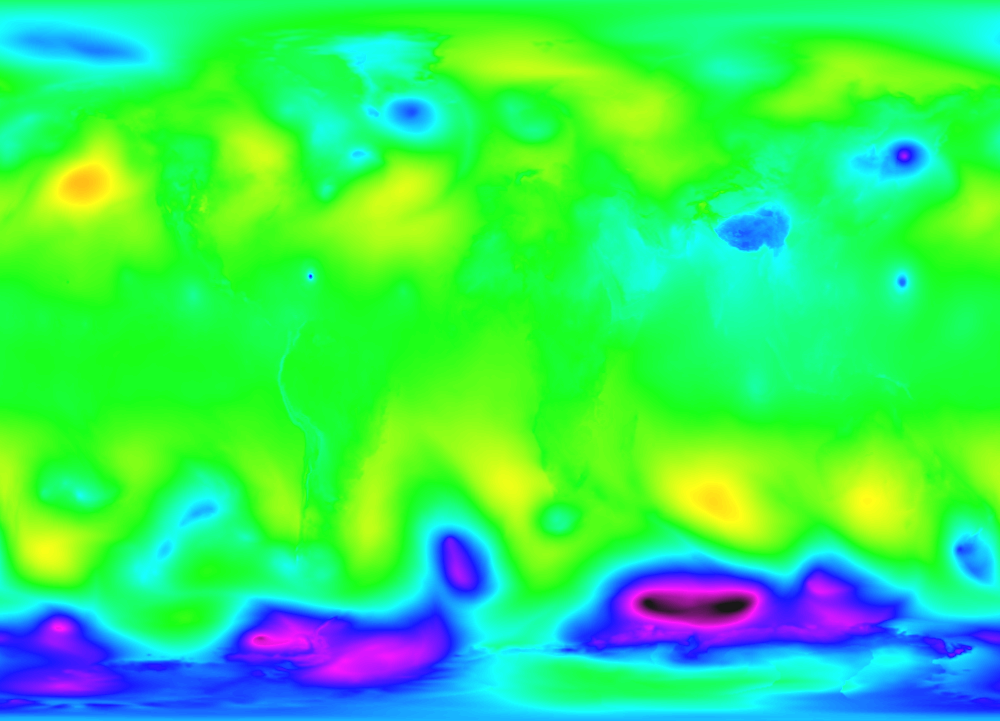
The weight of the Earth's atmosphere exerts pressure on the surface of the Earth. This pressure varies from place-to-place due the variations in the Earth's surface since higher altitudes have less atmosphere above them than lower altitudes. Atmospheric pressure also varies from time-to-time due to the uneven heating of the atmosphere by the sun and the rotation of the Earth, causing weather. In order to see the changes in pressure which affect the weather, the variation due to altitude is removed from the surface pressure, creating a quantity called sea level pressure. This animation shows the atmospheric sea level pressure for the whole globe from September 1, 2004, through September 5, 2004, during the period of Hurricane Frances in the western Atlantic Ocean and Typhoon Songda in the western Pacific Ocean. The sharp, moving low pressures areas for Frances and Songda can be clearly seen in the oceans. Even with the direct effect of altitude removed, cold high-altitude regions such as the South Pole and the Himalayan Plateau still exhibit lower-than-normal pressures, probably due to the interaction of cold air over those regions with the warmer air in the surrounding regions.
Global Atmospheric Sea Level Pressure during Hurricane Frances (WMS)
Visualization Credits
Jeff de La Beaujardiere (NASA): Lead Animator
Horace Mitchell (NASA/GSFC): Animator
William Putman (NASA/GSFC): Scientist
Horace Mitchell (NASA/GSFC): Animator
William Putman (NASA/GSFC): Scientist
Please give credit for this item to:
NASA/Goddard Space Flight Center Scientific Visualization Studio
NASA/Goddard Space Flight Center Scientific Visualization Studio
Short URL to share this page:
https://svs.gsfc.nasa.gov/3182
Data Used:
Note: While we identify the data sets used in these visualizations, we do not store any further details nor the data sets themselves on our site.
This item is part of these series:
WMS
fvGCM
Keywords:
DLESE >> Atmospheric science
SVS >> HDTV
DLESE >> Natural hazards
GCMD >> Earth Science >> Atmosphere >> Atmospheric Phenomena >> Hurricanes
GCMD >> Earth Science >> Atmosphere >> Atmospheric Phenomena >> Typhoons
GCMD >> Earth Science >> Atmosphere >> Atmospheric Pressure >> Sea Level Pressure
GCMD >> Earth Science >> Human Dimensions >> Natural Hazards >> Meteorological Hazards
GCMD >> Location >> Global
SVS >> Hurricane Frances
SVS >> Hyperwall
NASA Science >> Earth
GCMD keywords can be found on the Internet with the following citation: Olsen, L.M., G. Major, K. Shein, J. Scialdone, S. Ritz, T. Stevens, M. Morahan, A. Aleman, R. Vogel, S. Leicester, H. Weir, M. Meaux, S. Grebas, C.Solomon, M. Holland, T. Northcutt, R. A. Restrepo, R. Bilodeau, 2013. NASA/Global Change Master Directory (GCMD) Earth Science Keywords. Version 8.0.0.0.0
https://svs.gsfc.nasa.gov/3182
Data Used:
fvGCM/U200 (200 hPa U wind (Inst) [m/s])
Model - NASA - 2005-09-01T03:00 -- 2005-09-05T24:00fvGCM/Global Large-scale Precipitation
Model - NASA - 2005-09-01T03:00 -- 2005-09-05T24:00fvGCM/Global Surface Latent Heat Flux
Model - NASA - 2005-09-01T03:00 -- 2005-09-05T24:00fvGCM/Global Atmospheric Surface Pressure
Model - NASA - 2005-09-01T03:00 -- 2005-09-05T24:00fvGCM/Global Convective Precipitation
Model - NASA - 2005-09-01T03:00 -- 2005-09-05T24:00fvGCM/Global Atmospheric Water Vapor
Model - NASA - 2005-09-01T03:00 -- 2005-09-05T24:00fvGCM/Global Surface Wind Speed
Model - NASA - 2005-09-01T03:00 -- 2005-09-05T24:00fvGCM/W850 (850 hPa Vertical Velocity (Inst) [m/s])
Model - NASA - 2005-09-01T03:00 -- 2005-09-05T24:00fvGCM/W200 (200 hPa Vertical Velocity (Inst) [m/s])
Model - NASA - 2005-09-01T03:00 -- 2005-09-05T24:00fvGCM/W10M (10 meter Vertical Velocity (Inst) [m/s])
Model - NASA - 2005-09-01T03:00 -- 2005-09-05T24:00fvGCM/V850 (850 hPa V wind (Inst) [m/s])
Model - NASA - 2005-09-01T03:00 -- 2005-09-05T24:00fvGCM/V200 (200 hPa V wind (Inst) [m/s])
Model - NASA - 2005-09-01T03:00 -- 2005-09-05T24:00fvGCM/V10M (10 meter V wind (Inst) [m/s])
Model - NASA - 2005-09-01T03:00 -- 2005-09-05T24:00fvGCM/U850 (850 hPa U wind (Inst) [m/s])
Model - NASA - 2005-09-01T03:00 -- 2005-09-05T24:00fvGCM/CLDTOT (Vertically-integrated, random overlap, total cloud cover (Inst) [fraction])
Model - NASA - 2005-09-01T03:00 -- 2005-09-05T24:00fvGCM/U10M (10 meter U wind (Inst) [m/s])
Model - NASA - 2005-09-01T03:00 -- 2005-09-05T24:00fvGCM/TQ (Total precipitable water (Inst) [kg/m2])
Model - NASA - 2005-09-01T03:00 -- 2005-09-05T24:00fvGCM/THICK (Thickness of the 500 hPa to 1000 hPa Layer (5400m = freezing line) (Inst) [m])
Model - NASA - 2005-09-01T03:00 -- 2005-09-05T24:00fvGCM/T850 (850 hPa temperature (Inst) [K])
Model - NASA - 2005-09-01T03:00 -- 2005-09-05T24:00fvGCM/T2M (2 meter temperature (Inst) (K))
Model - NASA - 2005-09-01T03:00 -- 2005-09-05T24:00fvGCM/SLP (Sea level pressure (Inst) [Pa])
Model - NASA - 2005-09-01T03:00 -- 2005-09-05T24:00fvGCM/Predicted Track
Model - NASA - 2005-09-01T03:00 -- 2005-09-05T24:00fvGCM/PRECP (instant precip rate at output time)
Model - NASA - 2005-09-01T03:00 -- 2005-09-05T24:00fvGCM/PRECL (Large-scale precipitation rate (Inst) [mm/day])
Model - NASA - 2005-09-01T03:00 -- 2005-09-05T24:00fvGCM/PRECC (Convective precipitation rate (Inst) [mm/day])
Model - NASA - 2005-09-01T03:00 -- 2005-09-05T24:00fvGCM/LHFX (Surface latent heat flux (Inst) [W/m2])
Model - NASA - 2005-09-01T03:00 -- 2005-09-05T24:00fvGCM/H500 (500 hPa Geopotential height (Inst) [m])
Model - NASA - 2005-09-01T03:00 -- 2005-09-05T24:00fvGCM/H300 (300 hPa Geopotential height (Inst) [m])
Model - NASA - 2005-09-01T03:00 -- 2005-09-05T24:00This item is part of these series:
WMS
fvGCM
Keywords:
DLESE >> Atmospheric science
SVS >> HDTV
DLESE >> Natural hazards
GCMD >> Earth Science >> Atmosphere >> Atmospheric Phenomena >> Hurricanes
GCMD >> Earth Science >> Atmosphere >> Atmospheric Phenomena >> Typhoons
GCMD >> Earth Science >> Atmosphere >> Atmospheric Pressure >> Sea Level Pressure
GCMD >> Earth Science >> Human Dimensions >> Natural Hazards >> Meteorological Hazards
GCMD >> Location >> Global
SVS >> Hurricane Frances
SVS >> Hyperwall
NASA Science >> Earth
GCMD keywords can be found on the Internet with the following citation: Olsen, L.M., G. Major, K. Shein, J. Scialdone, S. Ritz, T. Stevens, M. Morahan, A. Aleman, R. Vogel, S. Leicester, H. Weir, M. Meaux, S. Grebas, C.Solomon, M. Holland, T. Northcutt, R. A. Restrepo, R. Bilodeau, 2013. NASA/Global Change Master Directory (GCMD) Earth Science Keywords. Version 8.0.0.0.0


