Earth
ID: 3129
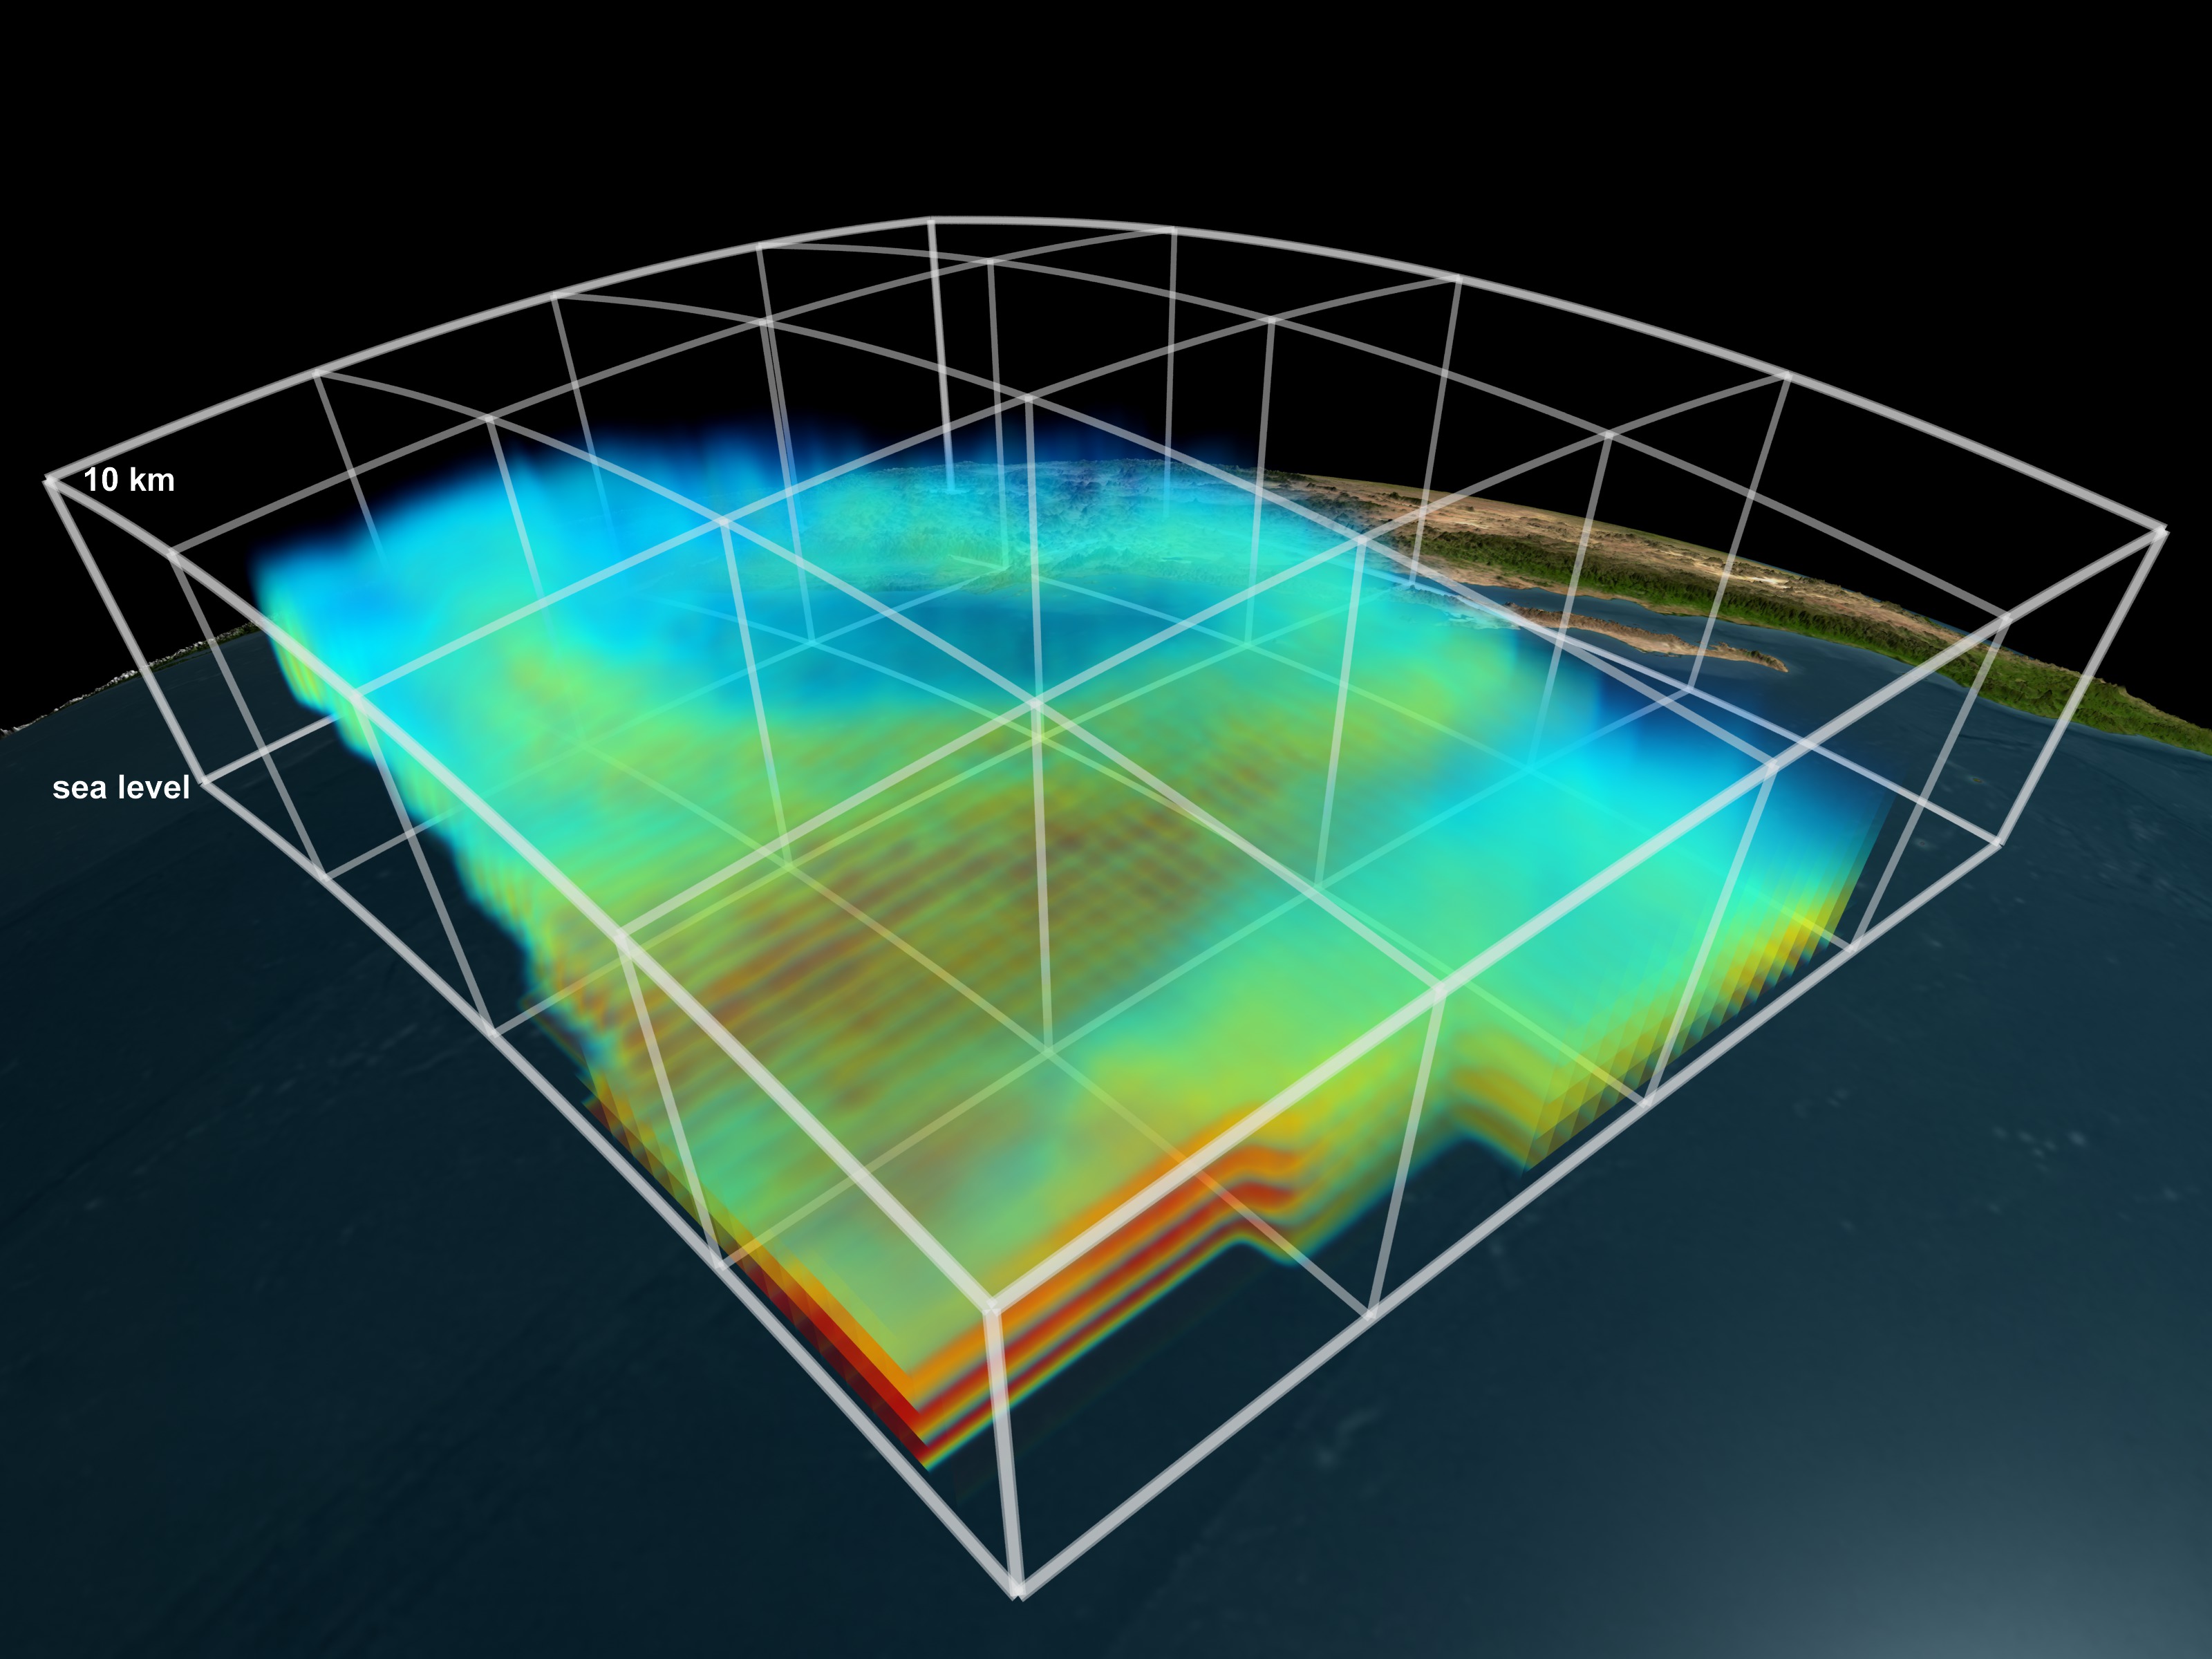
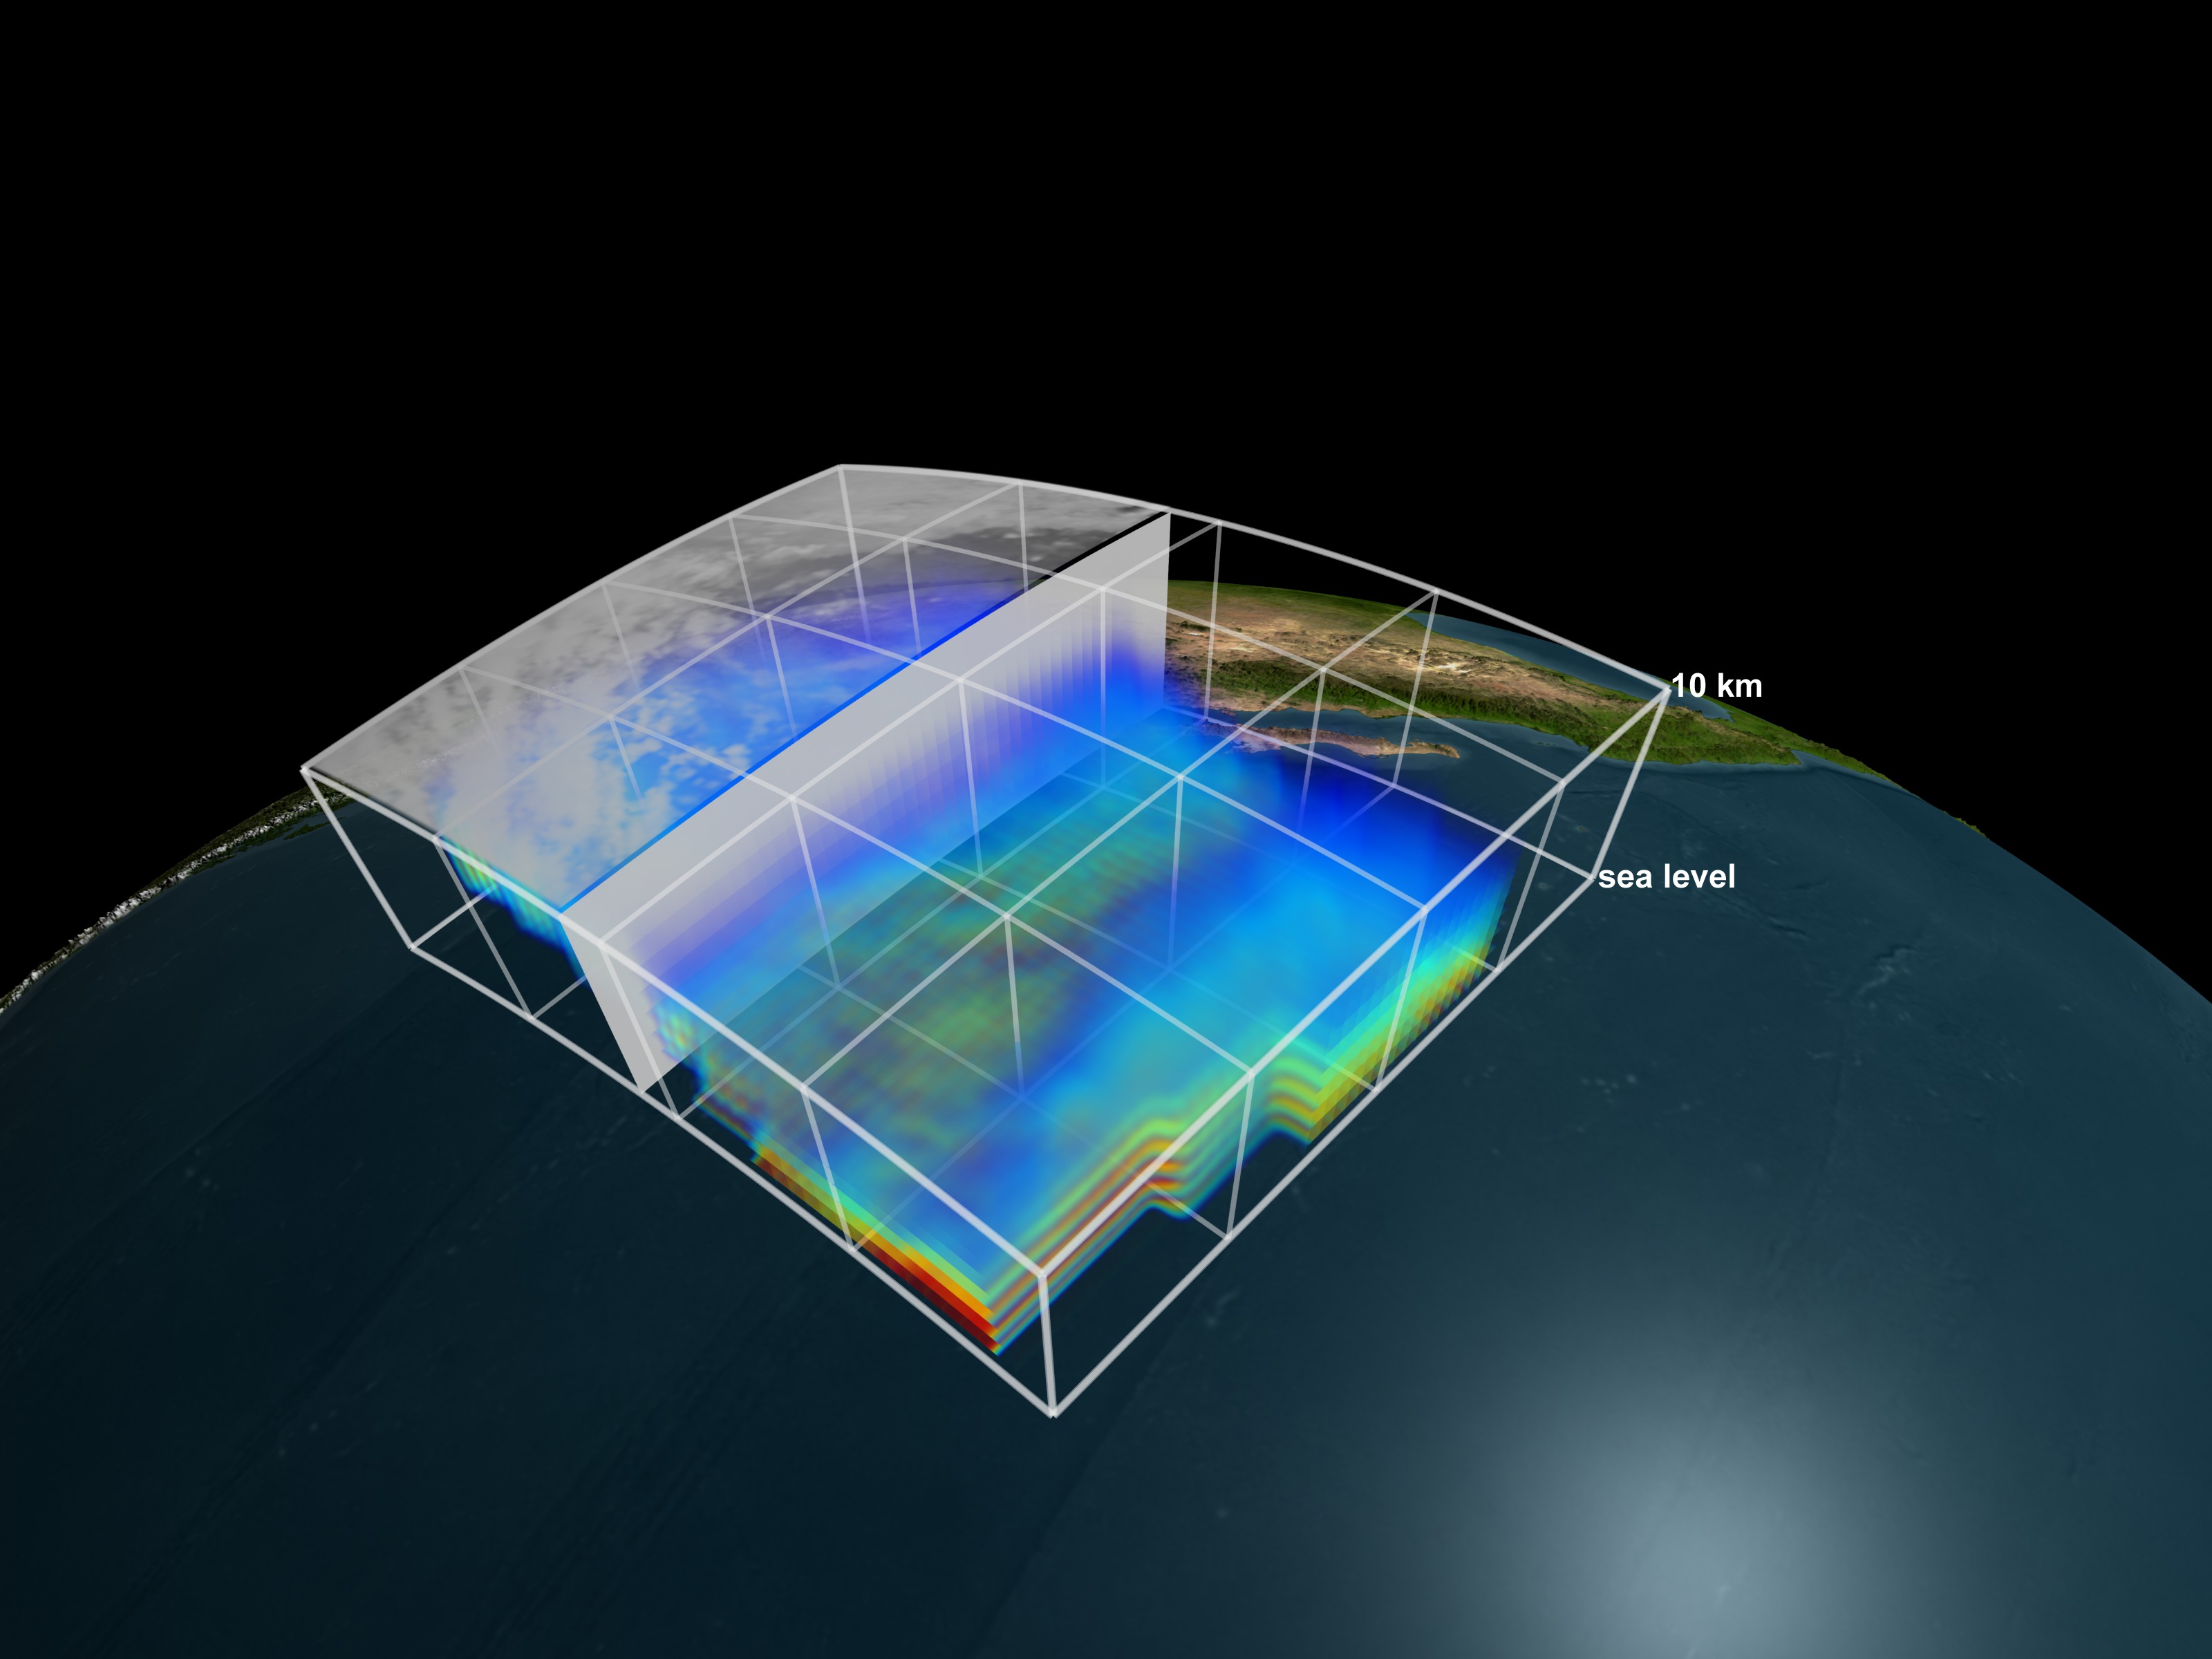
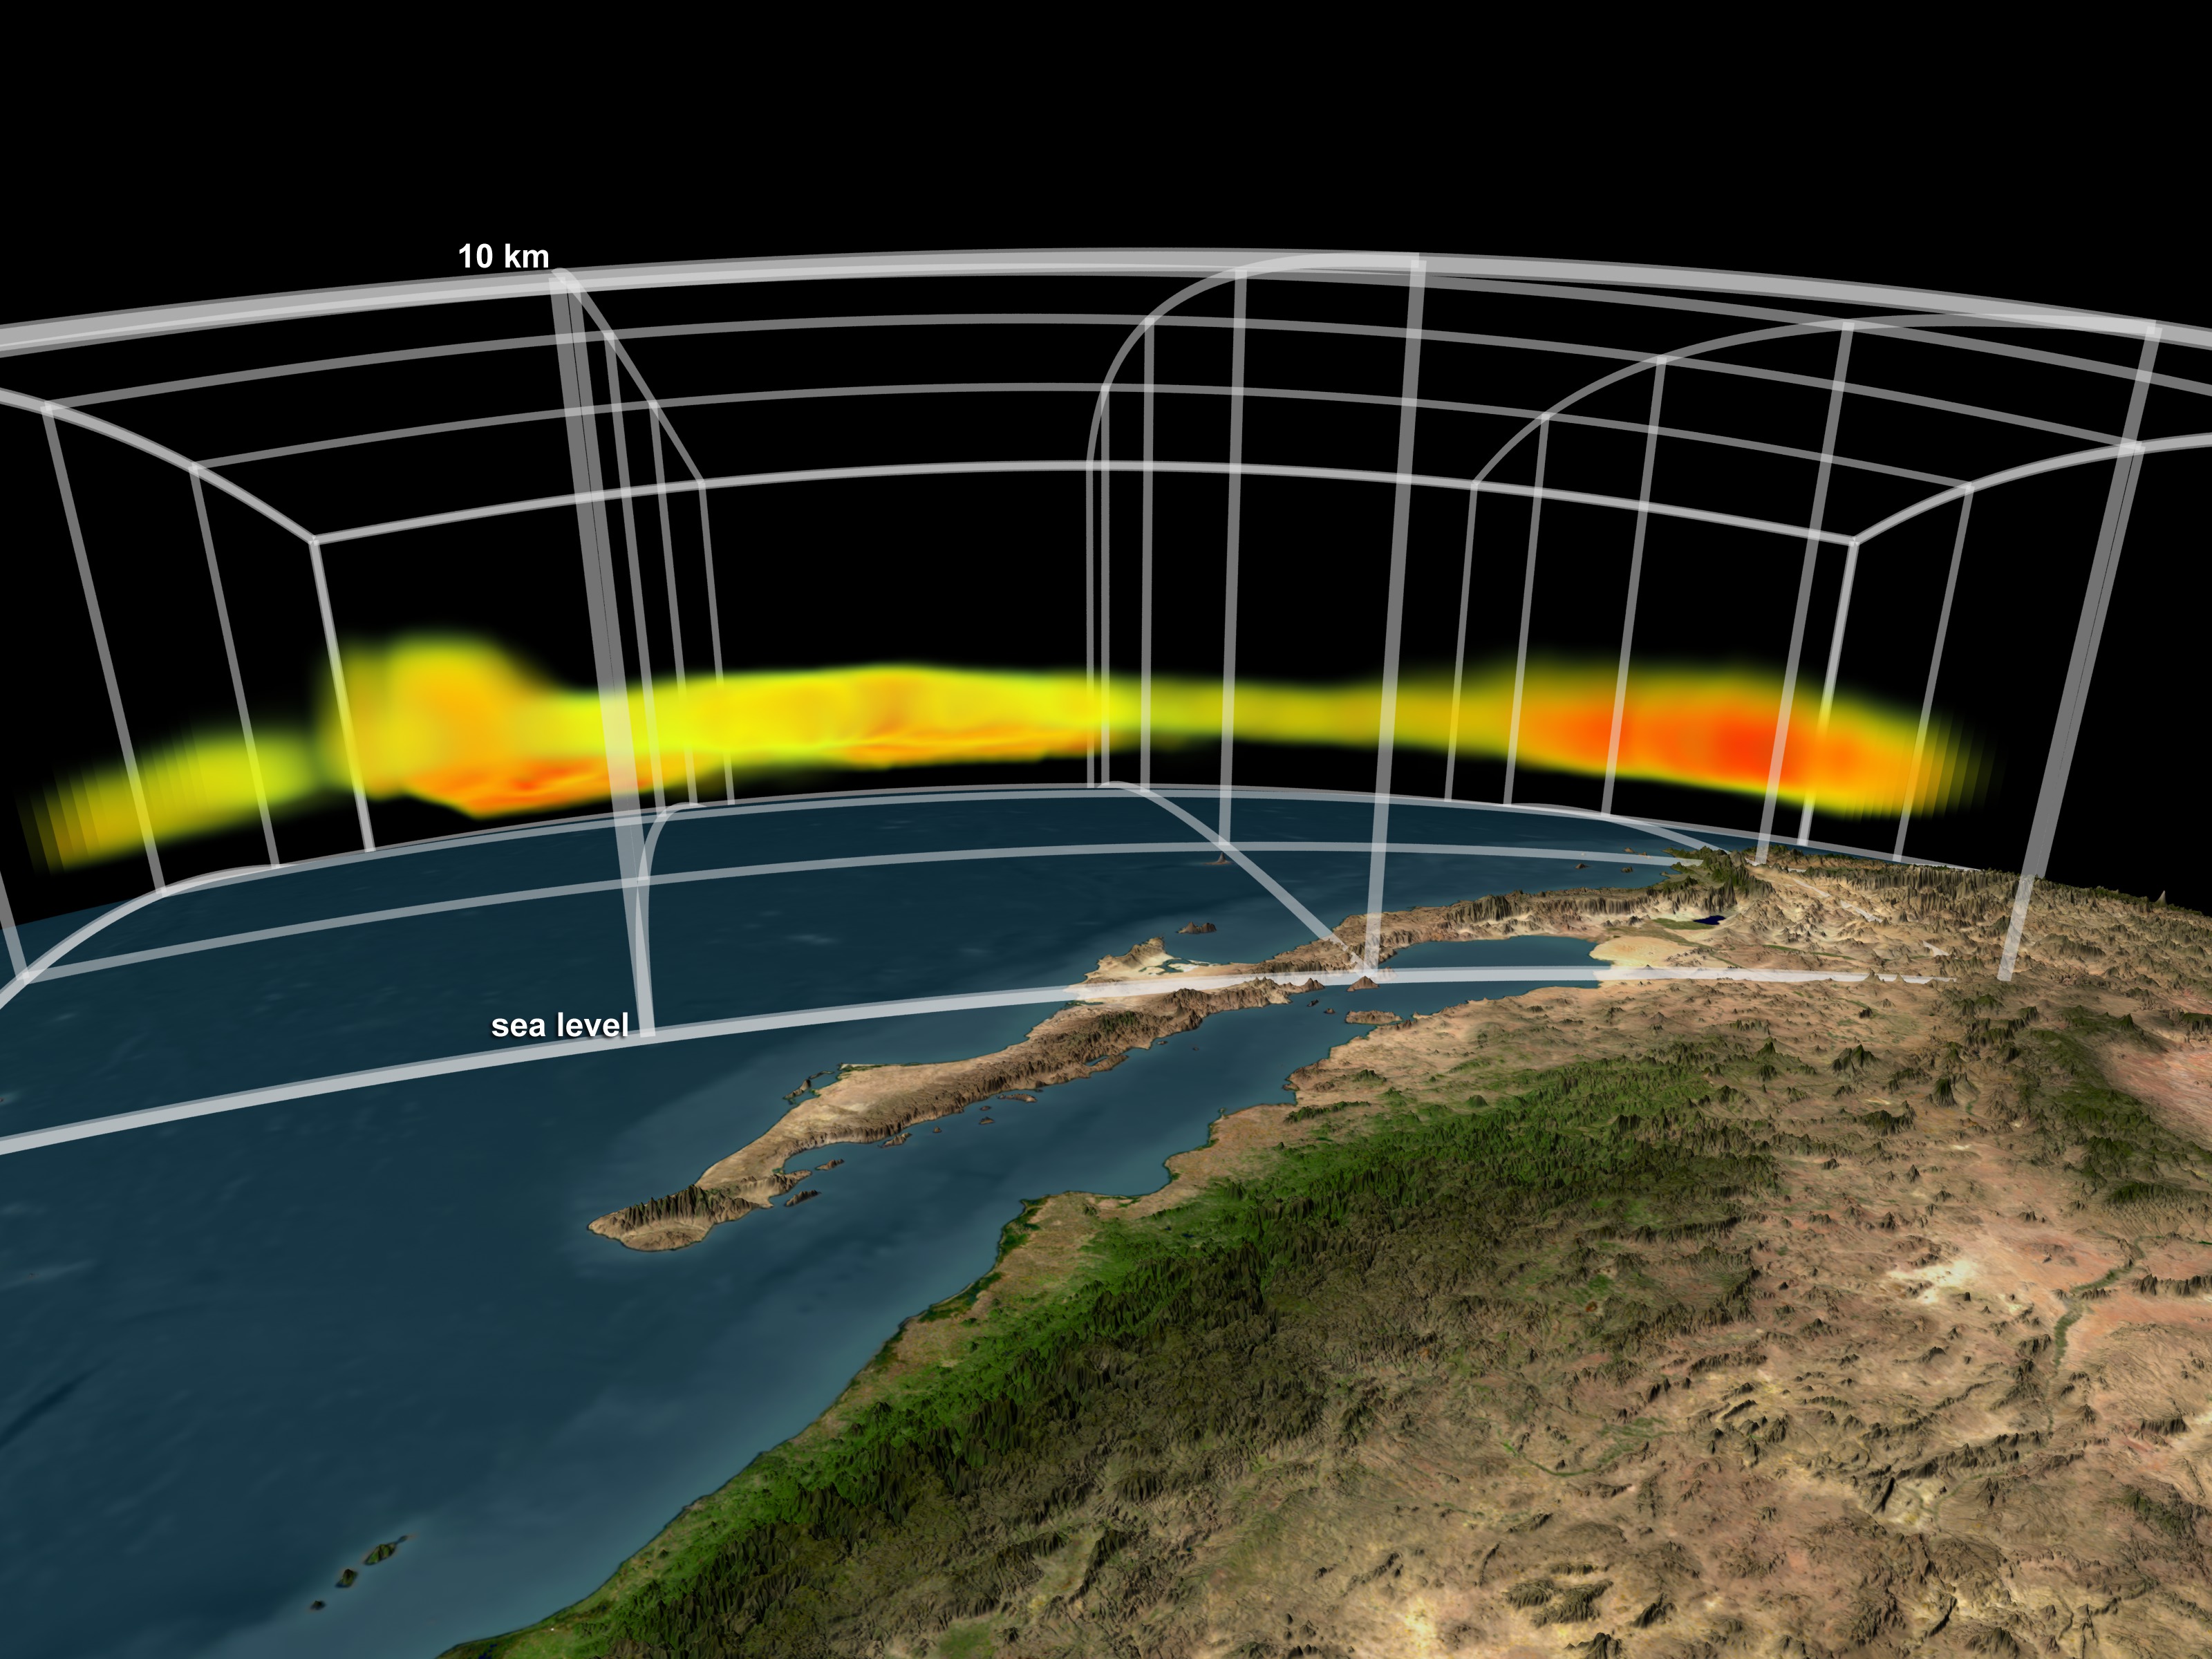
This visualization shows 3D volumetric water vapor data from the Aqua/Atmospheric Infrared Sounder (AIRS) instrument. As the camera moved down and around the data set, the low data values are faded out revealing only the highest concentrations of water vapor data.

Aqua/AIRS Water Vapor near Southern California #2
This version (#2) ends with a slightly lower threshold than the original version - showing more of the highest water vapor concentrations.
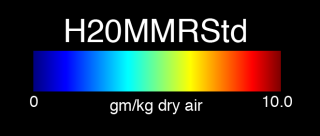
The color and opacity at each 3D voxel are driven by the water vapor data. The data set was obtained by Aqua on January 1, 2003. Only data from the sea level to about 10km are shown.
This visualization was created to support a JPL press release about how assimilated AIRS data is improving global atmospheric simulation model forecasts by about 6 hours (from about 5 days to about 5 days and 6 hours).
Visualization Credits
Greg Shirah (NASA/GSFC): Lead Animator
Sharon Okonek (NASA/JPL CalTech): Scientist
Bjorn H. Lambrigtsen (NASA/JPL CalTech): Scientist
Tom Pagano (NASA/JPL CalTech): Scientist
Edward Olsen (NASA/JPL CalTech): Scientist
Sharon Okonek (NASA/JPL CalTech): Scientist
Bjorn H. Lambrigtsen (NASA/JPL CalTech): Scientist
Tom Pagano (NASA/JPL CalTech): Scientist
Edward Olsen (NASA/JPL CalTech): Scientist
Please give credit for this item to:
NASA/Goddard Space Flight Center Scientific Visualization Studio
NASA/Goddard Space Flight Center Scientific Visualization Studio
Short URL to share this page:
https://svs.gsfc.nasa.gov/3129
Data Used:
Note: While we identify the data sets used in these visualizations, we do not store any further details nor the data sets themselves on our site.
Dates of Data Used:
2003/01/01
Goddard TV Tape:
G2008-042HD -- HD Fires, Ozone, and Air Quality RT
Keywords:
SVS >> HDTV
SVS >> Volume
GCMD >> Earth Science >> Atmosphere >> Atmospheric Water Vapor >> Water Vapor
SVS >> Hyperwall
NASA Science >> Earth
GCMD keywords can be found on the Internet with the following citation: Olsen, L.M., G. Major, K. Shein, J. Scialdone, S. Ritz, T. Stevens, M. Morahan, A. Aleman, R. Vogel, S. Leicester, H. Weir, M. Meaux, S. Grebas, C.Solomon, M. Holland, T. Northcutt, R. A. Restrepo, R. Bilodeau, 2013. NASA/Global Change Master Directory (GCMD) Earth Science Keywords. Version 8.0.0.0.0
https://svs.gsfc.nasa.gov/3129
Data Used:
Aqua/AIRS/Level 2 Water Vapor (H2OMMRStd)
2003/01/01Dates of Data Used:
2003/01/01
Goddard TV Tape:
G2008-042HD -- HD Fires, Ozone, and Air Quality RT
Keywords:
SVS >> HDTV
SVS >> Volume
GCMD >> Earth Science >> Atmosphere >> Atmospheric Water Vapor >> Water Vapor
SVS >> Hyperwall
NASA Science >> Earth
GCMD keywords can be found on the Internet with the following citation: Olsen, L.M., G. Major, K. Shein, J. Scialdone, S. Ritz, T. Stevens, M. Morahan, A. Aleman, R. Vogel, S. Leicester, H. Weir, M. Meaux, S. Grebas, C.Solomon, M. Holland, T. Northcutt, R. A. Restrepo, R. Bilodeau, 2013. NASA/Global Change Master Directory (GCMD) Earth Science Keywords. Version 8.0.0.0.0


