Earth
ID: 30709
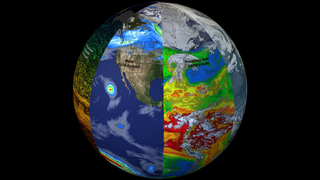
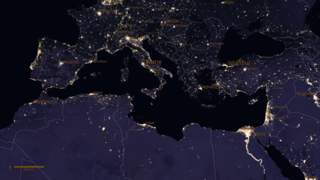
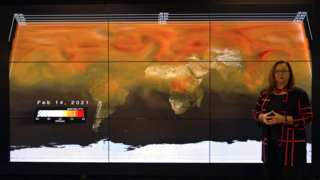
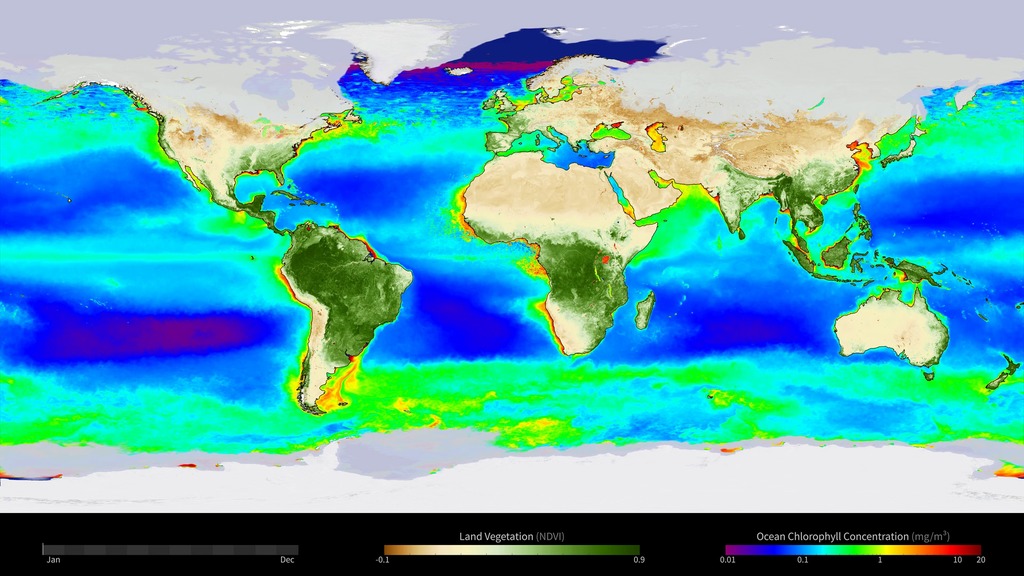
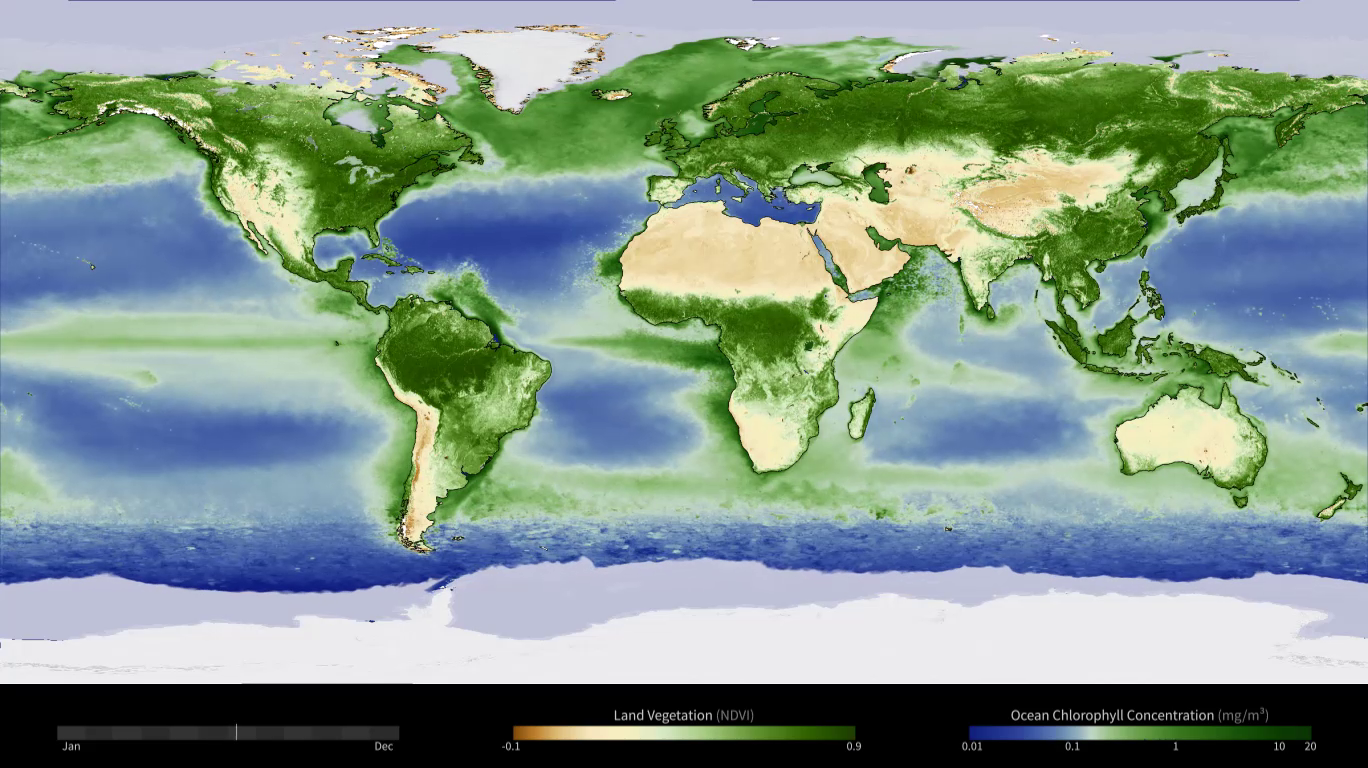
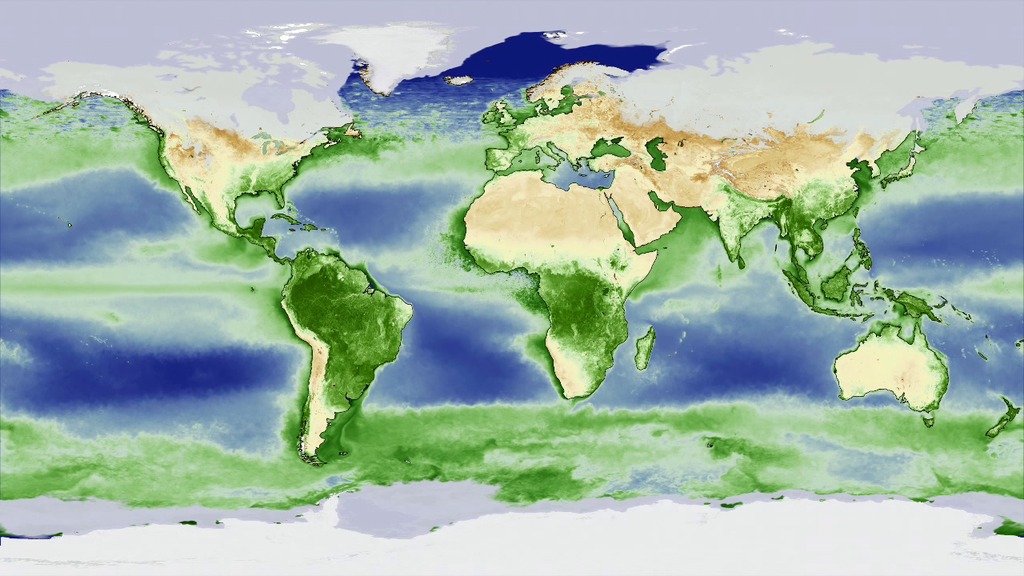
Satellite instruments reveal the yearly cycle of plant life on the land and in the water. On land, the images represent the density of plant growth, while in the oceans they show the chlorophyll concentration from tiny, plant-like organisms called phytoplankton. From December to February, during the northern hemisphere winter, plant life in the higher latitudes is minimal and receives little sunlight. However, even in the mid latitudes plants are dormant, shown here with browns and yellows on the land and dark blues in the ocean. By contrast the southern ocean and land masses are at the height of the summer season and plant life is revealed with dark green colors on the land and in the ocean. As the year progresses, the situations reverses, with plant life following the increased sunlight northward, while the southern hemisphere experiences decreased plant actvity during its' winter.
Rather than showing a specific year, the animation shows an average yearly cycle by combining data from many satellite instruments and averaging them over multiple years.
Data Sources include:
Land BioProductivity - VIP01P4 - A long term data record for Vegetation Phenology.
http://vip.arizona.edu/
1980-2010, running 7 day average
Ocean Color - GSMChl - a multi-satellite ocean color product made using Level 3, daily, binned imagery from SeaWiFS, MODIS-Aqua, Meris, and Viirs.
http://wiki.icess.ucsb.edu/measures/GSM
2003-2010, 29 day running average
Cryosphere data are:
Sea Ice - AMSR-E/Aqua Daily Sea Ice concentration
http://nsidc.org/data/AE_SI12
2002-2011, running 5-day average
Snow - IMS Daily Northern Hemisphere Snow and Ice Analysis
http://nsidc.org/data/G02156
2006-2014, running 29 day average
The supporting static/still data are used to show the permenent cryosphere features. They are:
Antarctic Icesheet - LIMA - Landsat Image Mosaic of Antarctica, this mosaic was created from Landsat images collected primarily during 1999–2003.
http://lima.usgs.gov
images collected primarily during 1999–2003.
Greenland Icesheet - MODIS composite from 2011 - this is a cloud-free mosaic from several images from summer 2011
Summer 2011
Glaciers - GLIMs glacier database
http://nsidc.org/data/nsidc-0272
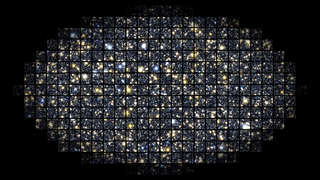
Yearly Cycle of Earth's Biosphere
Rather than showing a specific year, the animation shows an average yearly cycle by combining data from many satellite instruments and averaging them over multiple years.
Data Sources include:
Land BioProductivity - VIP01P4 - A long term data record for Vegetation Phenology.
http://vip.arizona.edu/
1980-2010, running 7 day average
Ocean Color - GSMChl - a multi-satellite ocean color product made using Level 3, daily, binned imagery from SeaWiFS, MODIS-Aqua, Meris, and Viirs.
http://wiki.icess.ucsb.edu/measures/GSM
2003-2010, 29 day running average
Cryosphere data are:
Sea Ice - AMSR-E/Aqua Daily Sea Ice concentration
http://nsidc.org/data/AE_SI12
2002-2011, running 5-day average
Snow - IMS Daily Northern Hemisphere Snow and Ice Analysis
http://nsidc.org/data/G02156
2006-2014, running 29 day average
The supporting static/still data are used to show the permenent cryosphere features. They are:
Antarctic Icesheet - LIMA - Landsat Image Mosaic of Antarctica, this mosaic was created from Landsat images collected primarily during 1999–2003.
http://lima.usgs.gov
images collected primarily during 1999–2003.
Greenland Icesheet - MODIS composite from 2011 - this is a cloud-free mosaic from several images from summer 2011
Summer 2011
Glaciers - GLIMs glacier database
http://nsidc.org/data/nsidc-0272
Source Material
Related
Credits
Please give credit for this item to:
NASA/Goddard Space Flight Center, The SeaWiFS Project and GeoEye. NOTE: All SeaWiFS images and data presented on this web site are for research and educational use only. All commercial use of SeaWiFS data must be coordinated with GeoEye (NOTE: In January 2013, DigitalGlobe and GeoEye combined to become DigitalGlobe).
NASA/Goddard Space Flight Center, The SeaWiFS Project and GeoEye. NOTE: All SeaWiFS images and data presented on this web site are for research and educational use only. All commercial use of SeaWiFS data must be coordinated with GeoEye (NOTE: In January 2013, DigitalGlobe and GeoEye combined to become DigitalGlobe).
Short URL to share this page:
https://svs.gsfc.nasa.gov/30709
Keywords:
SVS >> Carbon
SVS >> Chlorophyll
SVS >> HDTV
SVS >> Plankton
GCMD >> Earth Science >> Biosphere
GCMD >> Earth Science >> Biosphere >> Vegetation
SVS >> Hyperwall
NASA Science >> Earth
SVS >> Presentation
GCMD keywords can be found on the Internet with the following citation: Olsen, L.M., G. Major, K. Shein, J. Scialdone, S. Ritz, T. Stevens, M. Morahan, A. Aleman, R. Vogel, S. Leicester, H. Weir, M. Meaux, S. Grebas, C.Solomon, M. Holland, T. Northcutt, R. A. Restrepo, R. Bilodeau, 2013. NASA/Global Change Master Directory (GCMD) Earth Science Keywords. Version 8.0.0.0.0

