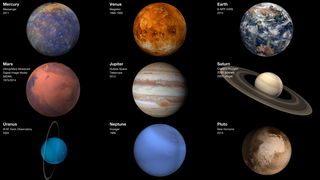
Earth
ID: 30598
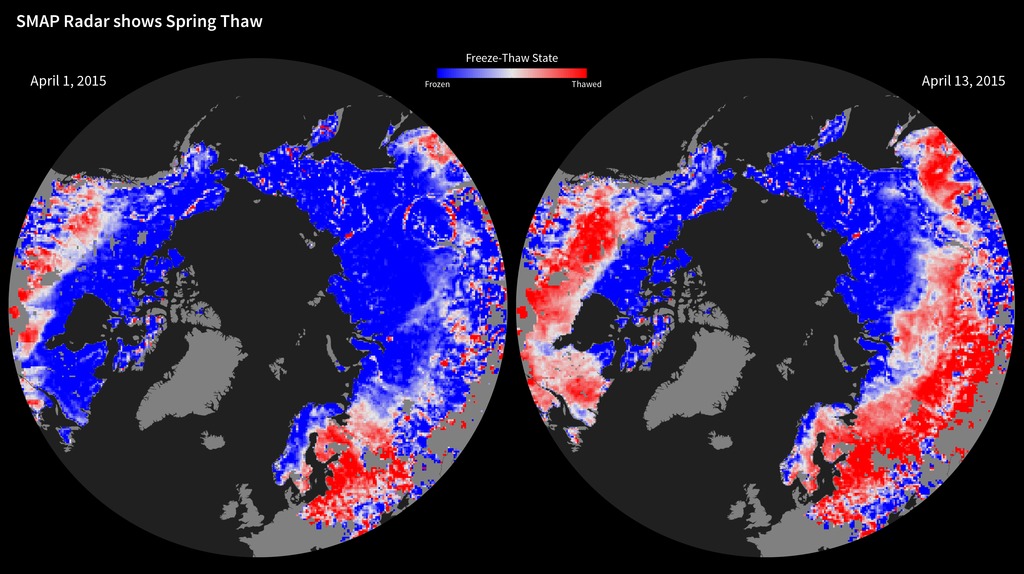
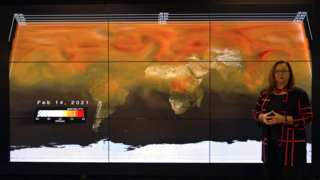
Launched in January 2015, the Soil Moisture Active Passive (SMAP) mission is NASA’s first Earth-observing satellite mission designed to collect continuous global observations of surface soil moisture and freeze/thaw state. Initial radar data from SMAP show the 2015 spring thaw in the Northern Hemisphere, with shades of red indicating regions where the landscape is thawed and shades of blue corresponding to frozen areas. The transition from frozen to thawed conditions is evident over extensive regions between the two images, acquired April 1 and April 13. For instance, the progression of melt northward across Alaska is evident, along with changes across the boreal forests of northern Canada (near Hudson Bay). Large areas of Russia also changed from frozen to thawed. The SMAP radar measurements indicate frozen soil conditions for some regions near the southern edge of the maps (in the United States and Eurasia), even though these regions are now thawed. This is a result of the influence of other characteristics of the land surface, such as soil moisture, on the radar signal.
SMAP Radar Shows Spring Thaw
Soil moisture and its freeze/thaw state are key determinants of the global carbon cycle. For example, carbon uptake by forests in boreal regions in the Northern Hemisphere is influenced by the length of the active vegetation growing season between the spring thaw and winter freeze transitions.
For More Information
Credits
Marit Jentoft-Nilsen: Project Support
Heather Hanson (GST): Writer
Mark Malanoski (GST): Project Support
Heather Hanson (GST): Writer
Mark Malanoski (GST): Project Support
Please give credit for this item to:
NASA/JPL-Caltech
NASA/JPL-Caltech
Short URL to share this page:
https://svs.gsfc.nasa.gov/30598
Mission:
Soil Moisture Active Passive (SMAP)
Data Used:
Note: While we identify the data sets used in these visualizations, we do not store any further details nor the data sets themselves on our site.
Keywords:
GCMD >> Earth Science >> Cryosphere >> Snow/Ice >> Freeze/Thaw
GCMD >> Location >> Northern Hemisphere
SVS >> Hyperwall
NASA Science >> Earth
SVS >> Presentation
GCMD keywords can be found on the Internet with the following citation: Olsen, L.M., G. Major, K. Shein, J. Scialdone, S. Ritz, T. Stevens, M. Morahan, A. Aleman, R. Vogel, S. Leicester, H. Weir, M. Meaux, S. Grebas, C.Solomon, M. Holland, T. Northcutt, R. A. Restrepo, R. Bilodeau, 2013. NASA/Global Change Master Directory (GCMD) Earth Science Keywords. Version 8.0.0.0.0
https://svs.gsfc.nasa.gov/30598
Mission:
Soil Moisture Active Passive (SMAP)
Data Used:
SMAP/Radar/L3_FT_A also referred to as: Freeze/Thaw State (Radar) Daily Composite
L3_FT_A, the only SMAP freeze/thaw product, consists of a daily composite of landscape freeze/thaw state for the boreal land region north of 45N latitude output on a polar EASE2 grid at 3 km. It is derived from high resolution radar data (L1C_S0_HiRes half-orbits) using both the AM (descending) and PM (ascending) overpasses.
Keywords:
GCMD >> Earth Science >> Cryosphere >> Snow/Ice >> Freeze/Thaw
GCMD >> Location >> Northern Hemisphere
SVS >> Hyperwall
NASA Science >> Earth
SVS >> Presentation
GCMD keywords can be found on the Internet with the following citation: Olsen, L.M., G. Major, K. Shein, J. Scialdone, S. Ritz, T. Stevens, M. Morahan, A. Aleman, R. Vogel, S. Leicester, H. Weir, M. Meaux, S. Grebas, C.Solomon, M. Holland, T. Northcutt, R. A. Restrepo, R. Bilodeau, 2013. NASA/Global Change Master Directory (GCMD) Earth Science Keywords. Version 8.0.0.0.0


