Earth
ID: 30515
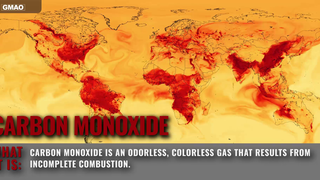
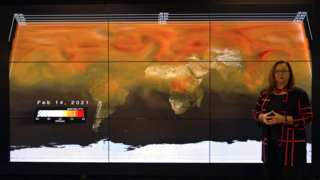
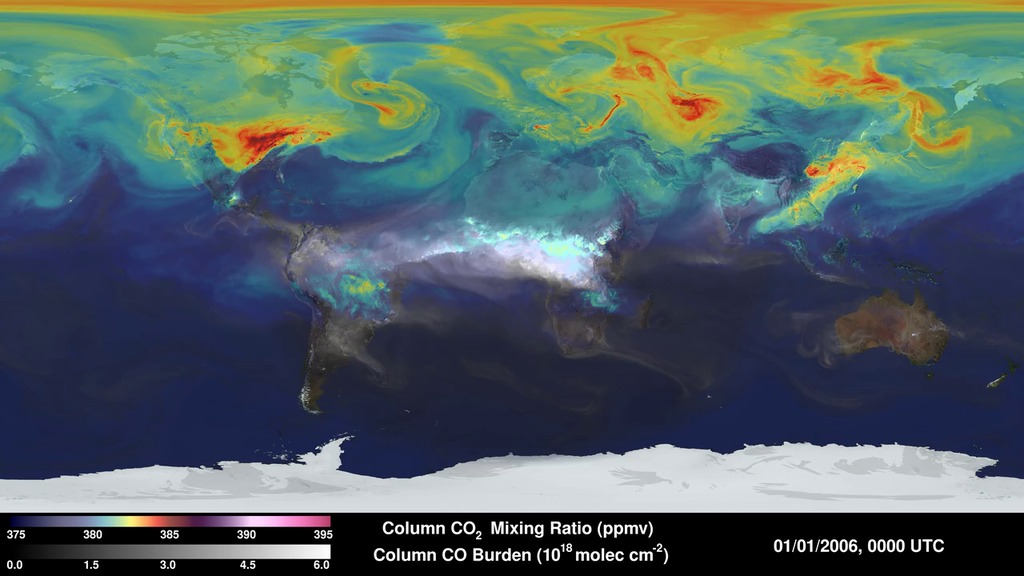
Carbon exists in many forms—e.g., carbon dioxide (CO2), carbon monoxide (CO)—and continually cycles through Earth’s atmosphere, ocean, and terrestrial ecosystems. This visualization, created using data from the 7-km GEOS-5 Nature Run model, shows average column concentrations of atmospheric CO2 (colored shades) and CO (white shades underneath) from January 1, 2006 to December 31, 2006.
CO2 variations are largely controlled by fossil fuel emissions and seasonal fluxes of carbon between the atmosphere and land biosphere. For example, dark red and pink shades represent regions where CO2 concentrations are enhanced by carbon sources, mainly from human activities. During Northern Hemisphere spring and summer months, plants absorb a substantial amount of CO2 through photosynthesis, thus removing CO2 from the atmosphere. Atmospheric CO, a pollutant harmful to human health, is produced mainly from fossil fuel combustion and biomass burning. Here, high concentrations of CO (white) are mainly from fire activity in Africa, South America, and Australia. Scientists use model output data such as these to help answer important questions about Earth’s climate and to help design future satellite missions.
These model simulations use fossil fuel emissions estimates provided by the Emissions Database for Global Atmospheric Research (EDGAR). NASA’s Quick Fire Emissions Dataset (QFED) estimates fire emissions using MODIS fire radiative power observations. Additional, observationally constrained estimates of CO2 flux between the atmosphere and land and ocean carbon reservoirs were produced as part of NASA’s Carbon Monitoring System Flux Pilot Project (http://carbon.nasa.gov/cgi-bin/cms/inv_pgp.pl?pgid=581). Land biosphere fluxes come from the Carnegie-Ames-Stanford Approach Global Fire Emissions Database (CASA-GFED) model which incorporates MODIS vegetation classification and AVHRR Normalized Difference Vegetation Index (NDVI) data. Ocean fluxes are produced by the NASA Ocean Biogeochemical Model (NOBM) which incorporates MODIS chlorophyll observations.
Simulated Atmospheric Carbon Concentrations
CO2 variations are largely controlled by fossil fuel emissions and seasonal fluxes of carbon between the atmosphere and land biosphere. For example, dark red and pink shades represent regions where CO2 concentrations are enhanced by carbon sources, mainly from human activities. During Northern Hemisphere spring and summer months, plants absorb a substantial amount of CO2 through photosynthesis, thus removing CO2 from the atmosphere. Atmospheric CO, a pollutant harmful to human health, is produced mainly from fossil fuel combustion and biomass burning. Here, high concentrations of CO (white) are mainly from fire activity in Africa, South America, and Australia. Scientists use model output data such as these to help answer important questions about Earth’s climate and to help design future satellite missions.
These model simulations use fossil fuel emissions estimates provided by the Emissions Database for Global Atmospheric Research (EDGAR). NASA’s Quick Fire Emissions Dataset (QFED) estimates fire emissions using MODIS fire radiative power observations. Additional, observationally constrained estimates of CO2 flux between the atmosphere and land and ocean carbon reservoirs were produced as part of NASA’s Carbon Monitoring System Flux Pilot Project (http://carbon.nasa.gov/cgi-bin/cms/inv_pgp.pl?pgid=581). Land biosphere fluxes come from the Carnegie-Ames-Stanford Approach Global Fire Emissions Database (CASA-GFED) model which incorporates MODIS vegetation classification and AVHRR Normalized Difference Vegetation Index (NDVI) data. Ocean fluxes are produced by the NASA Ocean Biogeochemical Model (NOBM) which incorporates MODIS chlorophyll observations.
Used Elsewhere In

Credits
William Putman (NASA/GSFC): Lead Animator
Lesley Ott (NASA/GSFC): Animator
Laurence Schuler (ADNET Systems, Inc.): Project Support
Ian Jones (ADNET Systems, Inc.): Project Support
Heather Hanson (GST): Writer
Lesley Ott (NASA/GSFC): Animator
Laurence Schuler (ADNET Systems, Inc.): Project Support
Ian Jones (ADNET Systems, Inc.): Project Support
Heather Hanson (GST): Writer
Please give credit for this item to:
NASA's Global Modeling and Assimilation Office
NASA's Global Modeling and Assimilation Office
Short URL to share this page:
https://svs.gsfc.nasa.gov/30515
Keywords:
DLESE >> Atmospheric science
SVS >> Carbon
SVS >> Carbon Absorption
SVS >> Carbon Cycle
SVS >> Carbon Dioxide
SVS >> Carbon Monoxide
SVS >> Carbon Release
DLESE >> Environmental science
SVS >> HDTV
SVS >> Simulation
GCMD >> Earth Science >> Atmosphere >> Air Quality >> Carbon Monoxide
GCMD >> Earth Science >> Atmosphere >> Atmospheric Chemistry/Carbon and Hydrocarbon Compounds >> Carbon Dioxide
SVS >> Hyperwall
SVS >> GEOS
NASA Science >> Earth
SVS >> Presentation
GCMD keywords can be found on the Internet with the following citation: Olsen, L.M., G. Major, K. Shein, J. Scialdone, S. Ritz, T. Stevens, M. Morahan, A. Aleman, R. Vogel, S. Leicester, H. Weir, M. Meaux, S. Grebas, C.Solomon, M. Holland, T. Northcutt, R. A. Restrepo, R. Bilodeau, 2013. NASA/Global Change Master Directory (GCMD) Earth Science Keywords. Version 8.0.0.0.0

