Earth
ID: 30469
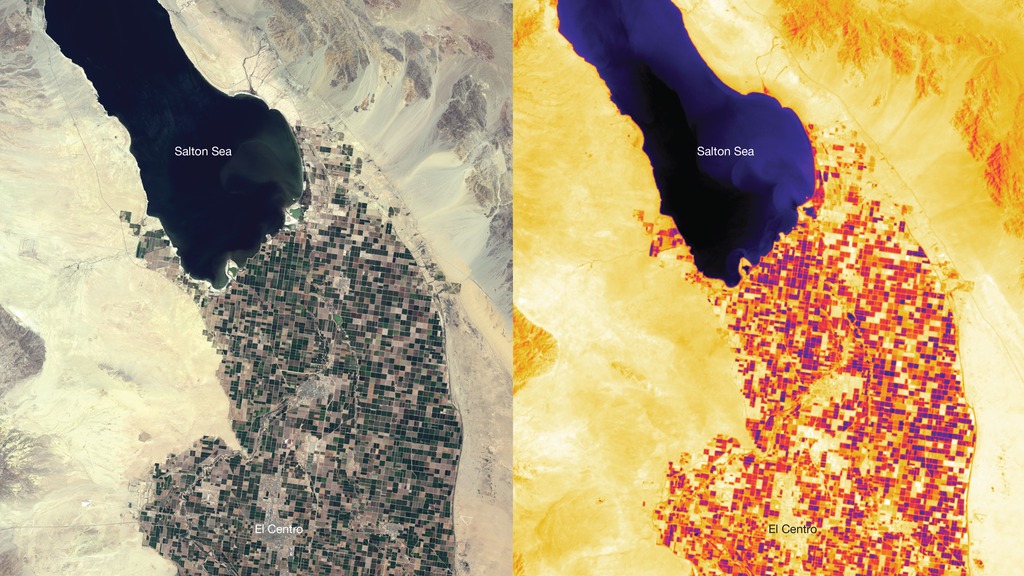
In the Western United States between 80 and 90% of freshwater is used for agriculture. In Southern California irrigated farmland stretches southward across the desert from the Salton Sea—an artificial inland sea—to the Mexico border. In the natural-color image [left] acquired on May 15, 2013, by Landsat 8’s Operational Land Imager, blocks of square farmland appear in shades of green and tan, while urban areas such as El Centro, California and Mexicali, Mexico appear in shades of gray. Accurate estimates of total crop area provided by Landsat satellites can be used to help forecast commodities in the United States and the world food market. On that same day, thermal measurements from Landsat 8’s Thermal Infrared Sensor [right] show different temperatures between crop fields as well as urban and desert areas. Cooler areas (e.g., irrigated crops) appear as dark purple and red shades, while warmer areas (e.g., urban and desert areas) appear as shades of bright yellow and white. Plants cool down when they transpire, so the combination of water evaporating from the plants and the ground (i.e., evapotranspiration) lowers the temperature of the irrigated land. Pixels representing cooler areas in thermal images from TIRS help water-resource managers determine where water is being used for irrigation, allowing them to make management decisions on water distribution to preserve this scarce resource. When an earlier design of Landsat 8 did not include a thermal infrared band, the Western States Water Council advocated for its inclusion.
Landsat Data Help Water-Resource Managers
Used in 2014 Calendar.
For More Information
Credits
Please give credit for this item to:
NASA
NASA
Short URL to share this page:
https://svs.gsfc.nasa.gov/30469
Missions:
Landsat
LDCM: Landsat Data Continuity Mission
Data Used:
Note: While we identify the data sets used in these visualizations, we do not store any further details nor the data sets themselves on our site.
This item is part of this series:
SMD 2014 Calendar images
Keywords:
GCMD >> Earth Science >> Agriculture >> Agricultural Plant Science >> Irrigation
GCMD >> Earth Science >> Atmosphere >> Atmospheric Water Vapor >> Evapotranspiration
GCMD >> Earth Science >> Land Surface >> Land Temperature >> Land Surface Temperature
SVS >> Hyperwall
NASA Science >> Earth
NASA Earth Science Focus Areas >> Water and Energy Cycle
NASA Earth Science Focus Areas >> Earth Surface and Interior
GCMD keywords can be found on the Internet with the following citation: Olsen, L.M., G. Major, K. Shein, J. Scialdone, S. Ritz, T. Stevens, M. Morahan, A. Aleman, R. Vogel, S. Leicester, H. Weir, M. Meaux, S. Grebas, C.Solomon, M. Holland, T. Northcutt, R. A. Restrepo, R. Bilodeau, 2013. NASA/Global Change Master Directory (GCMD) Earth Science Keywords. Version 8.0.0.0.0
https://svs.gsfc.nasa.gov/30469
Missions:
Landsat
LDCM: Landsat Data Continuity Mission
Data Used:
Landsat-8/OLI/Band Combination 2,3,4 also referred to as: True Color
Observed DataLandsat-8/TIRS
Observed DataThis item is part of this series:
SMD 2014 Calendar images
Keywords:
GCMD >> Earth Science >> Agriculture >> Agricultural Plant Science >> Irrigation
GCMD >> Earth Science >> Atmosphere >> Atmospheric Water Vapor >> Evapotranspiration
GCMD >> Earth Science >> Land Surface >> Land Temperature >> Land Surface Temperature
SVS >> Hyperwall
NASA Science >> Earth
NASA Earth Science Focus Areas >> Water and Energy Cycle
NASA Earth Science Focus Areas >> Earth Surface and Interior
GCMD keywords can be found on the Internet with the following citation: Olsen, L.M., G. Major, K. Shein, J. Scialdone, S. Ritz, T. Stevens, M. Morahan, A. Aleman, R. Vogel, S. Leicester, H. Weir, M. Meaux, S. Grebas, C.Solomon, M. Holland, T. Northcutt, R. A. Restrepo, R. Bilodeau, 2013. NASA/Global Change Master Directory (GCMD) Earth Science Keywords. Version 8.0.0.0.0


