Sun
ID: 2917
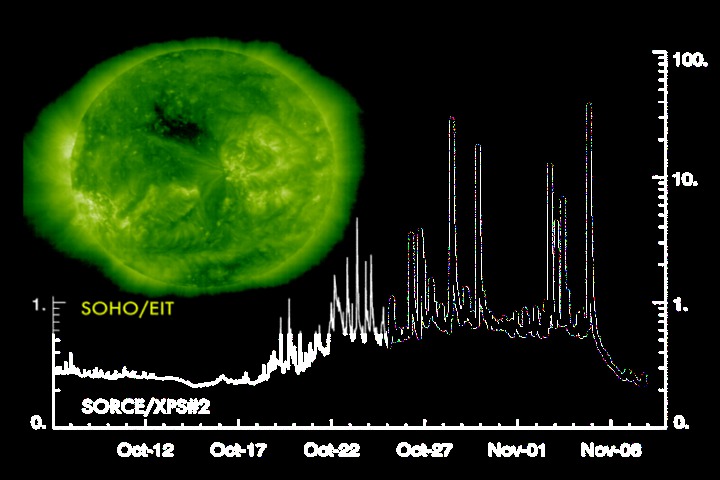
The SORCE mission monitors solar variability to determine its impact on the Earth's climate. The X-ray photometer aboard SORCE observes the record-breaking solar flares in the Fall of 2003. The line graph shows the photometer's measured solar radiation flux in the 1-7 nanometer wavelength band (x-ray) measured in milliwatts per square meter. The ultraviolet (195 angstrom) imagery from SOHO/EIT (green) illustrates where the flares (the bright white spots) are located on the solar disk.

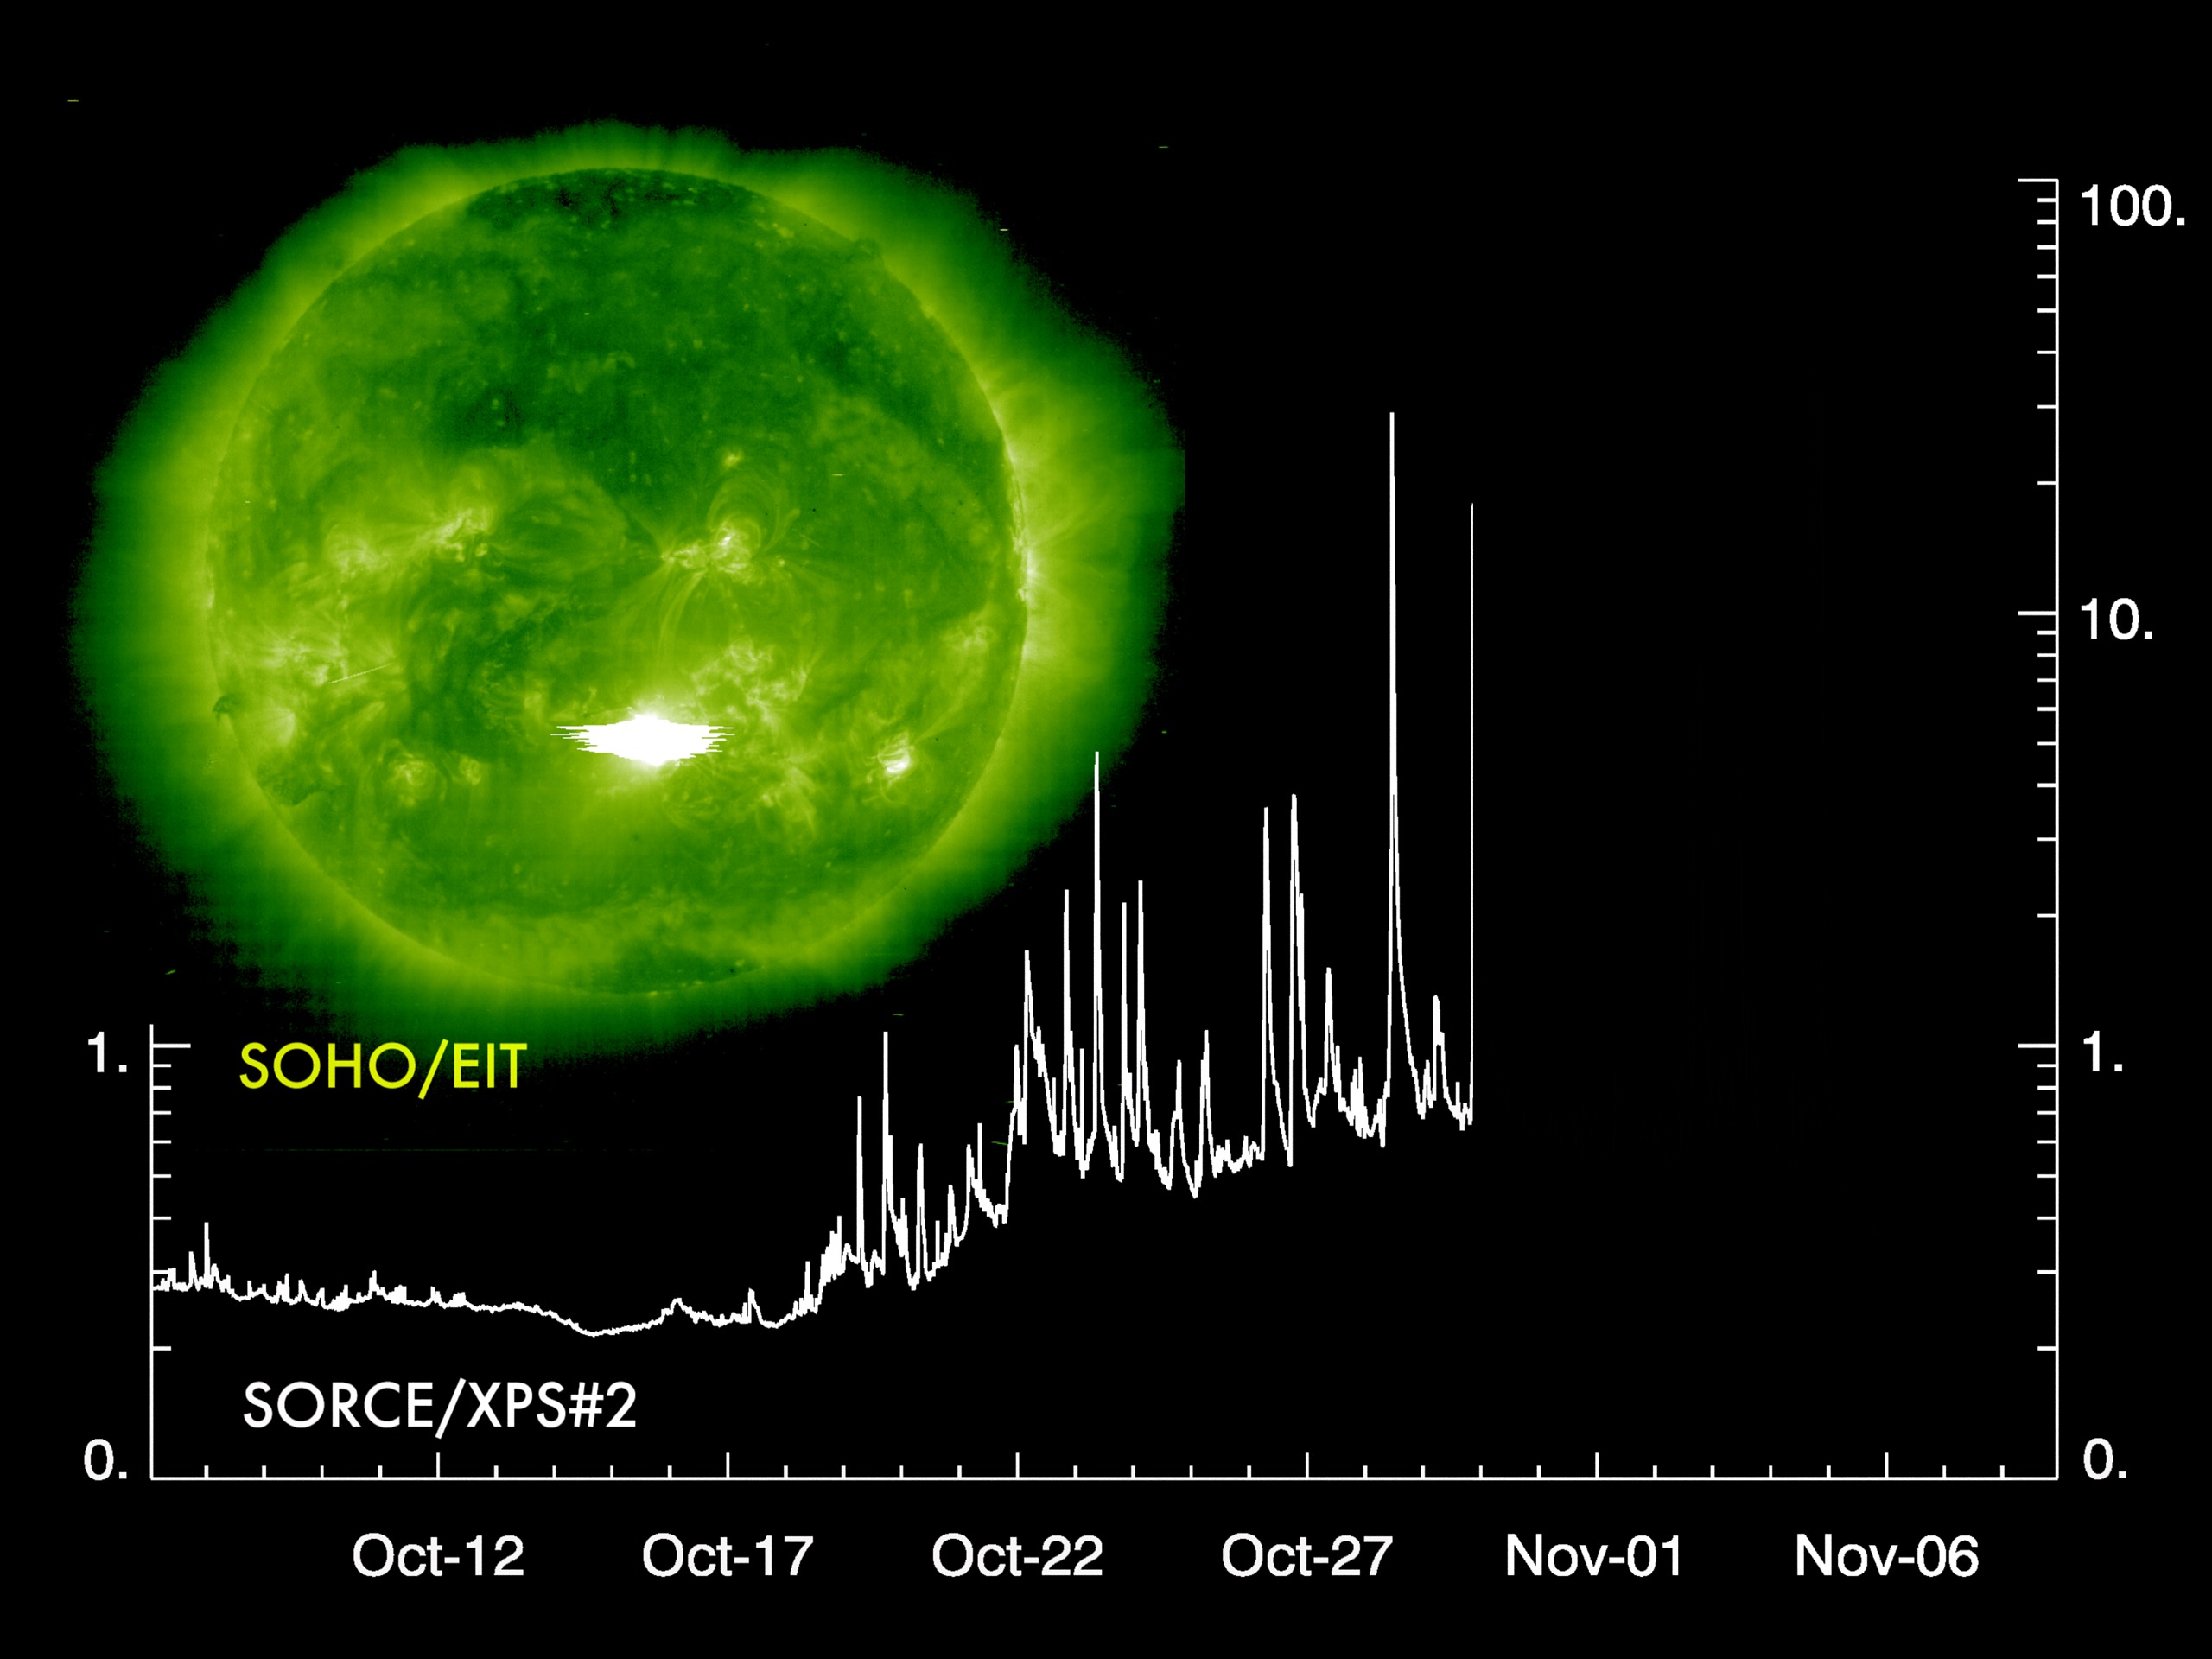
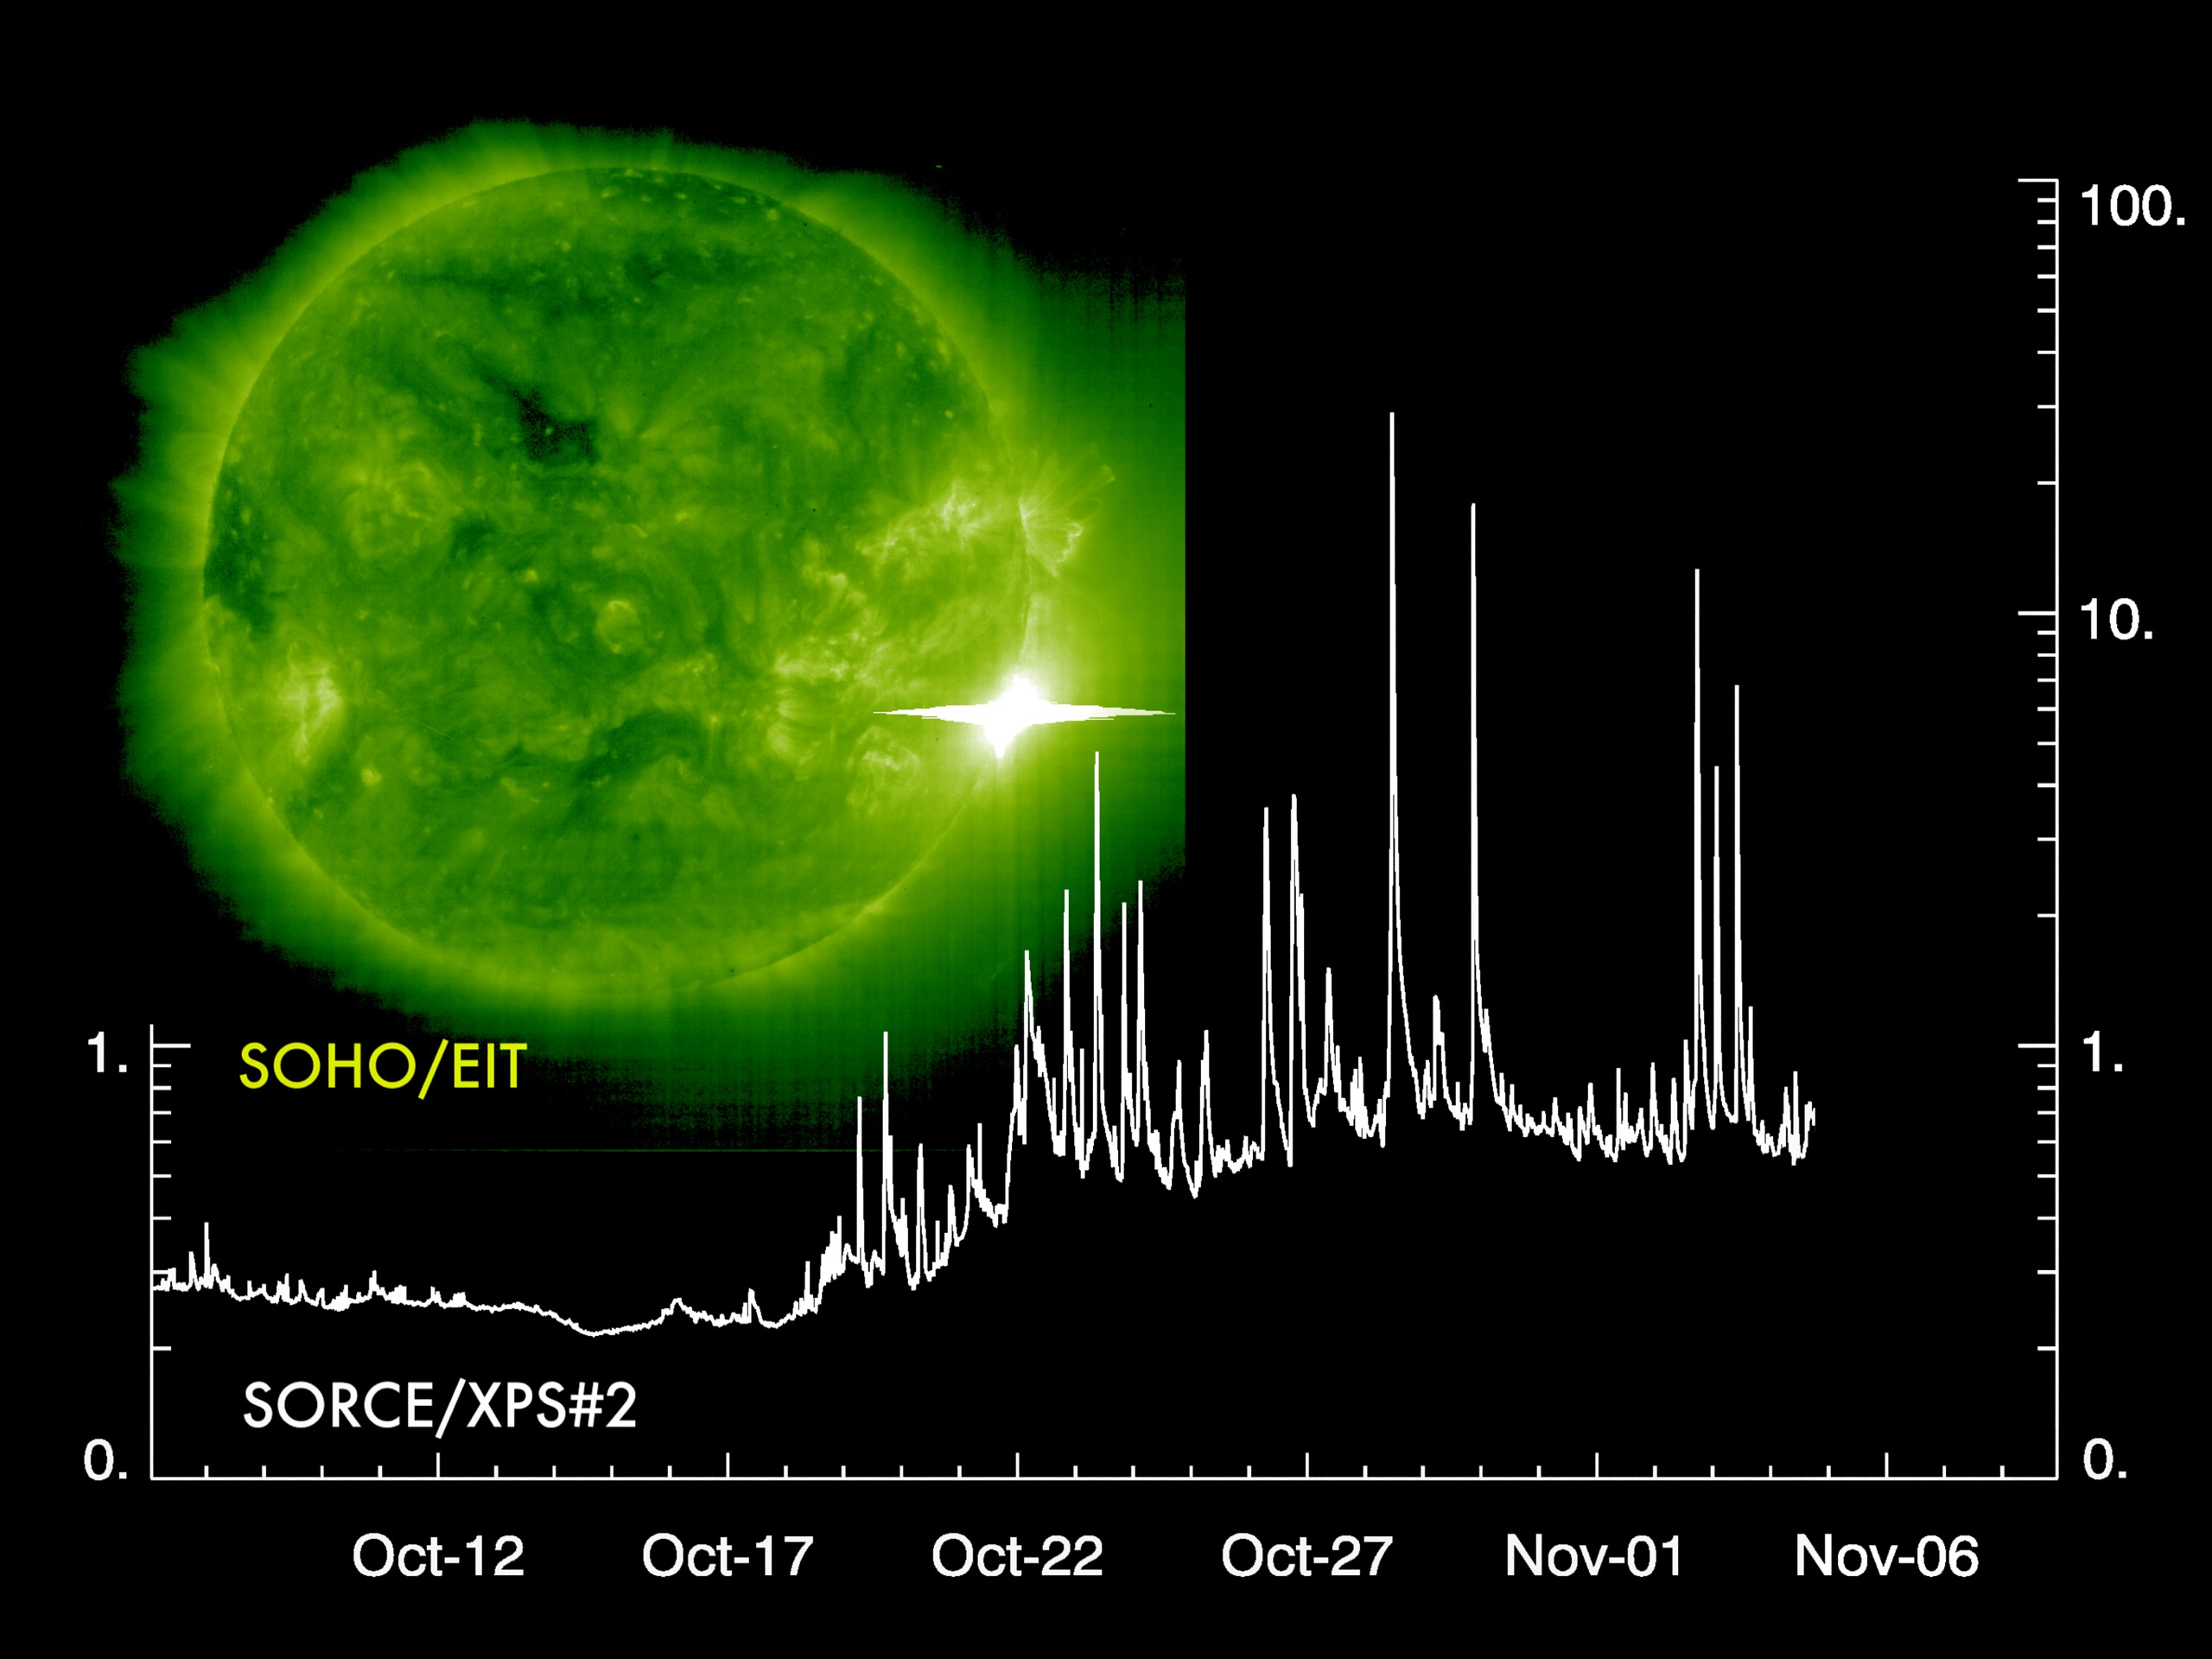
SORCE Monitors Solar Variability during Record Solar Flares
Visualization Credits
Tom Bridgman (Global Science and Technology, Inc.): Lead Animator
Marte Newcombe (GST): Animator
Gary Rottman (University of Colorado/LASP): Scientist
Tom Woods (University of Colorado): Scientist
Marte Newcombe (GST): Animator
Gary Rottman (University of Colorado/LASP): Scientist
Tom Woods (University of Colorado): Scientist
Please give credit for this item to:
NASA/Goddard Space Flight Center Scientific Visualization Studio
NASA/Goddard Space Flight Center Scientific Visualization Studio
Short URL to share this page:
https://svs.gsfc.nasa.gov/2917
Missions:
SOHO
Solar Radiation and Climate Experiment (SORCE)
Data Used:
Note: While we identify the data sets used in these visualizations, we do not store any further details nor the data sets themselves on our site.
This item is part of these series:
SORCE and Solar Flares
Halloween Solar Storms 2003: A Multi-Mission View
Astrophysics Stills
Goddard TV Tape:
G2004-009
Keywords:
SVS >> SOHO
SVS >> Solar Radiation
DLESE >> Space science
SVS >> X-ray
GCMD >> Earth Science >> Sun-earth Interactions >> Solar Activity >> Solar Active Regions
GCMD >> Earth Science >> Sun-earth Interactions >> Solar Activity >> Solar Flares
SVS >> For Educators
SVS >> Ultraviolet Imagery
NASA Science >> Sun
GCMD >> Earth Science >> Sun-earth Interactions >> Solar Energetic Particle Flux >> X-ray Flux
SVS >> Extreme Ultraviolet Imaging
SVS >> EUV Imaging
GCMD keywords can be found on the Internet with the following citation: Olsen, L.M., G. Major, K. Shein, J. Scialdone, S. Ritz, T. Stevens, M. Morahan, A. Aleman, R. Vogel, S. Leicester, H. Weir, M. Meaux, S. Grebas, C.Solomon, M. Holland, T. Northcutt, R. A. Restrepo, R. Bilodeau, 2013. NASA/Global Change Master Directory (GCMD) Earth Science Keywords. Version 8.0.0.0.0
https://svs.gsfc.nasa.gov/2917
Missions:
SOHO
Solar Radiation and Climate Experiment (SORCE)
Data Used:
SORCE/XPS
2003/10/25-2003/11/07SOHO/Extreme-UV Imaging Telescope (EIT)/195 Filter also referred to as: SOHO/EIT 195
NASA and ESA - 2003/10/25-2003/11/07This item is part of these series:
SORCE and Solar Flares
Halloween Solar Storms 2003: A Multi-Mission View
Astrophysics Stills
Goddard TV Tape:
G2004-009
Keywords:
SVS >> SOHO
SVS >> Solar Radiation
DLESE >> Space science
SVS >> X-ray
GCMD >> Earth Science >> Sun-earth Interactions >> Solar Activity >> Solar Active Regions
GCMD >> Earth Science >> Sun-earth Interactions >> Solar Activity >> Solar Flares
SVS >> For Educators
SVS >> Ultraviolet Imagery
NASA Science >> Sun
GCMD >> Earth Science >> Sun-earth Interactions >> Solar Energetic Particle Flux >> X-ray Flux
SVS >> Extreme Ultraviolet Imaging
SVS >> EUV Imaging
GCMD keywords can be found on the Internet with the following citation: Olsen, L.M., G. Major, K. Shein, J. Scialdone, S. Ritz, T. Stevens, M. Morahan, A. Aleman, R. Vogel, S. Leicester, H. Weir, M. Meaux, S. Grebas, C.Solomon, M. Holland, T. Northcutt, R. A. Restrepo, R. Bilodeau, 2013. NASA/Global Change Master Directory (GCMD) Earth Science Keywords. Version 8.0.0.0.0


