Earth
ID: 2794
This animation is of Hurricane Fabian on September 4, 2003 as it churns towards Bermuda. At this time, Fabian had maximum sustained winds of 120 mph and was moving to the north-northwest at 12 mph. The animation peels away the cloud layer and reveals the storm's rain structure. The yellow isosurface represents areas where at least 0.5 inches of rain fell per hour. The green isosurface show 1.0 inches of rain per hour and red displays where more than 2 inches of rain fell per hour.
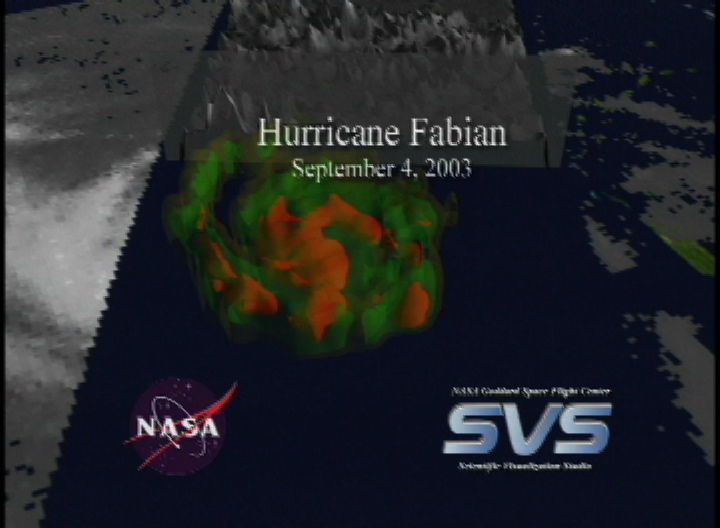
Hurricane Fabian Approaches Bermuda, September 4, 2003
Visualization Credits
Please give credit for this item to:
NASA/Goddard Space Flight Center Scientific Visualization Studio
NASA/Goddard Space Flight Center Scientific Visualization Studio
Short URL to share this page:
https://svs.gsfc.nasa.gov/2794
Mission:
Tropical Rainfall Measuring Mission - TRMM
Data Used:
Note: While we identify the data sets used in these visualizations, we do not store any further details nor the data sets themselves on our site.
This item is part of this series:
TRMM 3D Hurricanes
Keywords:
DLESE >> Atmospheric science
DLESE >> Natural hazards
SVS >> GOES
NASA Science >> Earth
https://svs.gsfc.nasa.gov/2794
Mission:
Tropical Rainfall Measuring Mission - TRMM
Data Used:
GOES-8
2003/09/04TRMM/TMI
2003/09/04TRMM/PR
2003/09/04TRMM/VIS
2003/09/04This item is part of this series:
TRMM 3D Hurricanes
Keywords:
DLESE >> Atmospheric science
DLESE >> Natural hazards
SVS >> GOES
NASA Science >> Earth


