Earth
ID: 2756
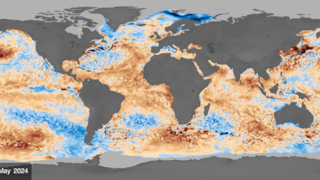
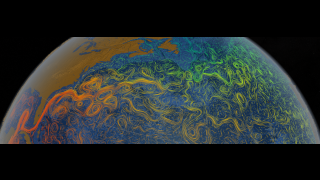
This animation show a year in the life of anomalous global ocean temperatures, June 2, 2002, to May 11, 2003. Green indicates the coolest water, yellow the warmest.
The Advanced Microwave Scanning Radiometer (AMSR-E) on the Aqua satellite is able to take measurements through clouds to provide this sea surface temperature data.

AMSR-E Global Anomalous Sea Surface Temperature Data Used to Forecast 2003 Hurricane Season
The Advanced Microwave Scanning Radiometer (AMSR-E) on the Aqua satellite is able to take measurements through clouds to provide this sea surface temperature data.

For More Information
Visualization Credits
Please give credit for this item to:
NASA/Goddard Space Flight Center Scientific Visualization Studio
NASA/Goddard Space Flight Center Scientific Visualization Studio
Short URL to share this page:
https://svs.gsfc.nasa.gov/2756
Data Used:
Note: While we identify the data sets used in these visualizations, we do not store any further details nor the data sets themselves on our site.
This item is part of this series:
El Niño and La Niña
Goddard TV Tape:
G2003-036
Keywords:
DLESE >> Atmospheric science
SVS >> El Nino
DLESE >> Physical oceanography
GCMD >> Earth Science >> Atmosphere >> Atmospheric Phenomena >> Hurricanes
SVS >> Hurricane Forecasting
NASA Science >> Earth
GCMD keywords can be found on the Internet with the following citation: Olsen, L.M., G. Major, K. Shein, J. Scialdone, S. Ritz, T. Stevens, M. Morahan, A. Aleman, R. Vogel, S. Leicester, H. Weir, M. Meaux, S. Grebas, C.Solomon, M. Holland, T. Northcutt, R. A. Restrepo, R. Bilodeau, 2013. NASA/Global Change Master Directory (GCMD) Earth Science Keywords. Version 8.0.0.0.0
https://svs.gsfc.nasa.gov/2756
Data Used:
Aqua/AMSR-E
06/02/2003 - 05/11/2003
For more information, please click http://wwwghcc.msfc.nasa.gov/AMSR/
This item is part of this series:
El Niño and La Niña
Goddard TV Tape:
G2003-036
Keywords:
DLESE >> Atmospheric science
SVS >> El Nino
DLESE >> Physical oceanography
GCMD >> Earth Science >> Atmosphere >> Atmospheric Phenomena >> Hurricanes
SVS >> Hurricane Forecasting
NASA Science >> Earth
GCMD keywords can be found on the Internet with the following citation: Olsen, L.M., G. Major, K. Shein, J. Scialdone, S. Ritz, T. Stevens, M. Morahan, A. Aleman, R. Vogel, S. Leicester, H. Weir, M. Meaux, S. Grebas, C.Solomon, M. Holland, T. Northcutt, R. A. Restrepo, R. Bilodeau, 2013. NASA/Global Change Master Directory (GCMD) Earth Science Keywords. Version 8.0.0.0.0
