Earth
ID: 2457
This is Hurricane Alma on May 29, 2002 as seen by TRMM and GOES.
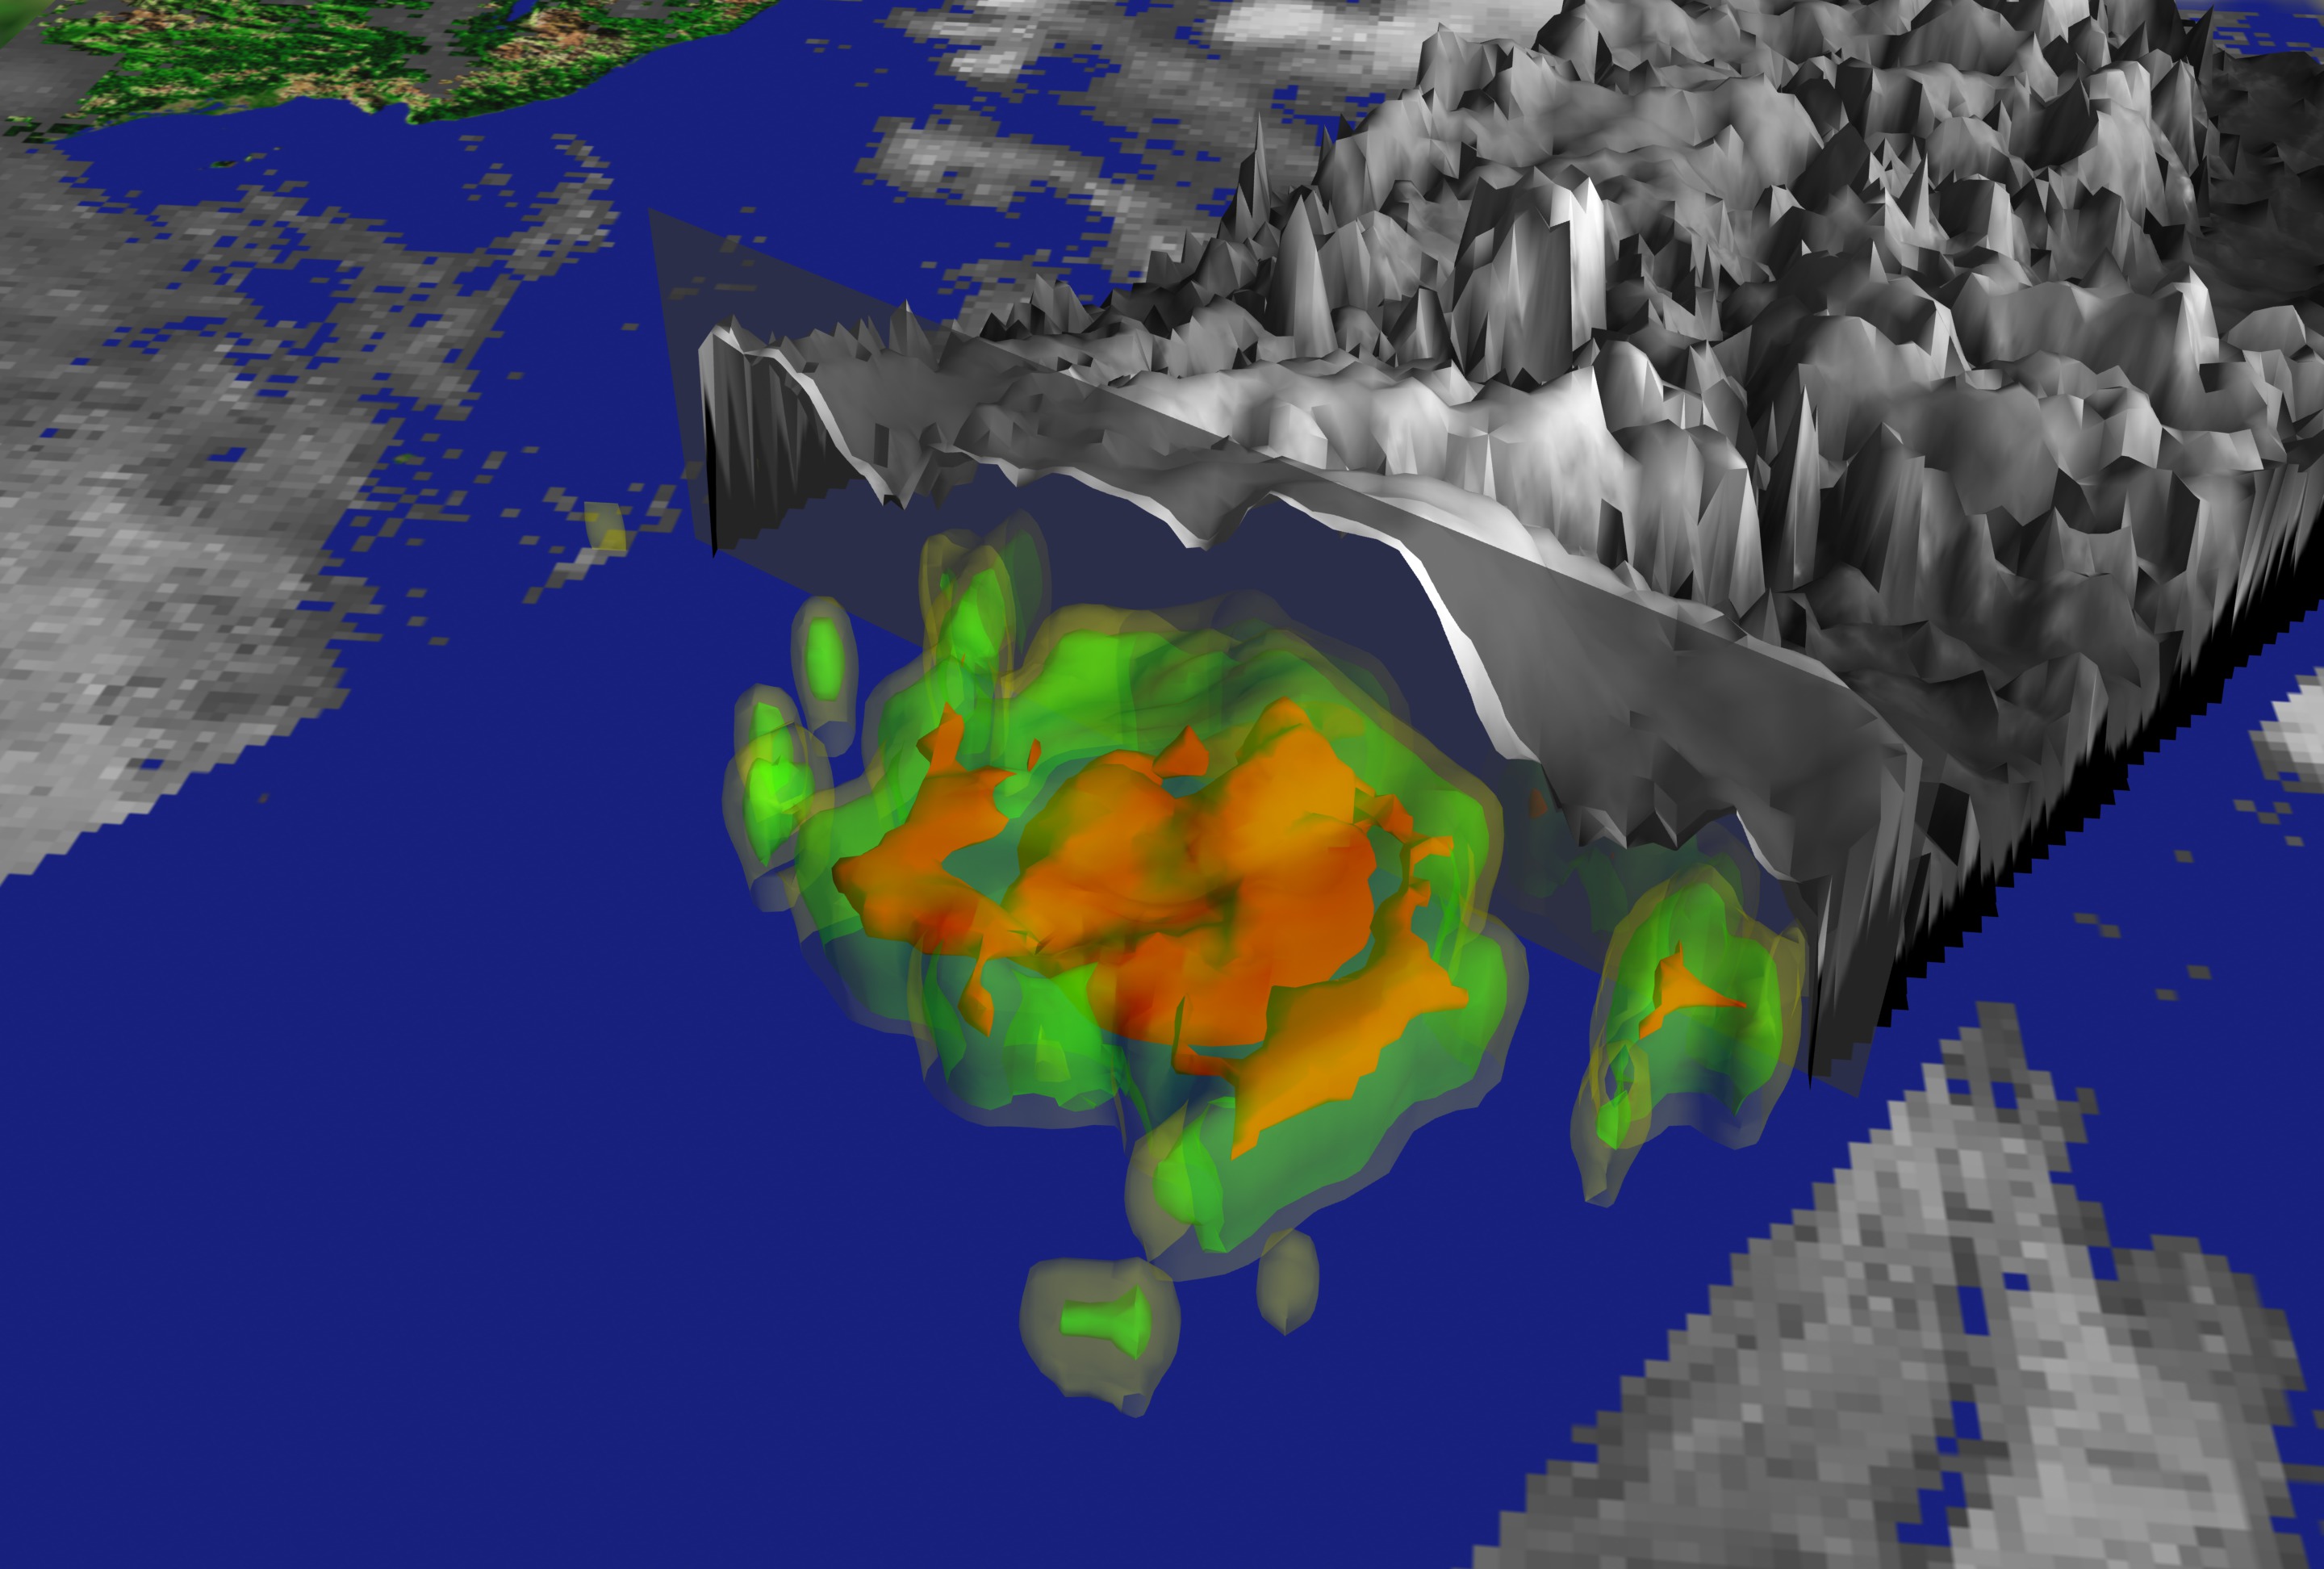


Hurricane Alma on May 29, 2002
The animation zooms down to Hurricane Alma and then scans across the cloud tops to reveal the underlying rain structure. There are three isosurfaces defined (Yellow = 0.5 inches/hour, Green = 1.0 inches/hour, and Red = 2.0 inches/hour)
Visualization Credits
Please give credit for this item to:
NASA/Goddard Space Flight Center Scientific Visualization Studio
NASA/Goddard Space Flight Center Scientific Visualization Studio
Short URL to share this page:
https://svs.gsfc.nasa.gov/2457
Mission:
Tropical Rainfall Measuring Mission - TRMM
Data Used:
Note: While we identify the data sets used in these visualizations, we do not store any further details nor the data sets themselves on our site.
This item is part of this series:
TRMM 3D Hurricanes
Keywords:
DLESE >> Atmospheric science
DLESE >> Natural hazards
GCMD >> Earth Science >> Atmosphere >> Atmospheric Phenomena >> Hurricanes
SVS >> GOES
NASA Science >> Earth
GCMD keywords can be found on the Internet with the following citation: Olsen, L.M., G. Major, K. Shein, J. Scialdone, S. Ritz, T. Stevens, M. Morahan, A. Aleman, R. Vogel, S. Leicester, H. Weir, M. Meaux, S. Grebas, C.Solomon, M. Holland, T. Northcutt, R. A. Restrepo, R. Bilodeau, 2013. NASA/Global Change Master Directory (GCMD) Earth Science Keywords. Version 8.0.0.0.0
https://svs.gsfc.nasa.gov/2457
Mission:
Tropical Rainfall Measuring Mission - TRMM
Data Used:
GOES
2002/05/29TRMM/PR
2002/05/29TRMM/TMI
2002/05/29TRMM/VIS
2002/05/29This item is part of this series:
TRMM 3D Hurricanes
Keywords:
DLESE >> Atmospheric science
DLESE >> Natural hazards
GCMD >> Earth Science >> Atmosphere >> Atmospheric Phenomena >> Hurricanes
SVS >> GOES
NASA Science >> Earth
GCMD keywords can be found on the Internet with the following citation: Olsen, L.M., G. Major, K. Shein, J. Scialdone, S. Ritz, T. Stevens, M. Morahan, A. Aleman, R. Vogel, S. Leicester, H. Weir, M. Meaux, S. Grebas, C.Solomon, M. Holland, T. Northcutt, R. A. Restrepo, R. Bilodeau, 2013. NASA/Global Change Master Directory (GCMD) Earth Science Keywords. Version 8.0.0.0.0


