Earth
ID: 206


El Niño Monthly Sea Surface Temperature Anomaly Stills: June 1997 through June 1998
An animation of sea surface temperature anomaly in the Pacific from June 1997 through June 1998 as measured by NOAA AVHRR
Sea surface temperature anomaly in the Pacific for June 1997 as measured by NOAA AVHRR
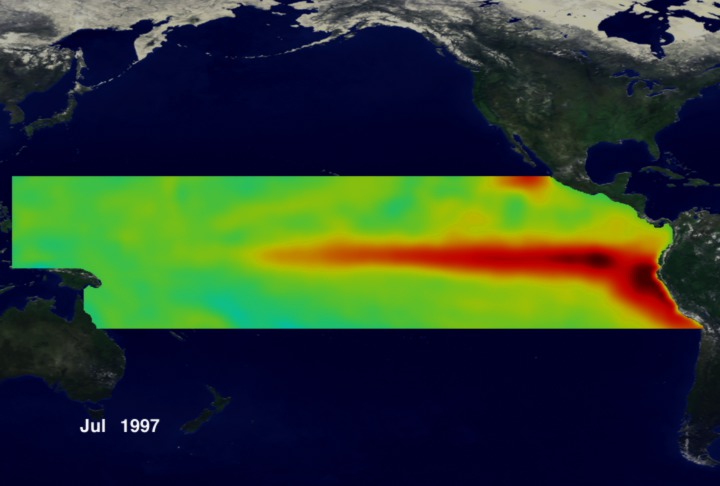
Sea surface temperature anomaly in the Pacific for July 1997 as measured by NOAA AVHRR
Sea surface temperature anomaly in the Pacific for August 1997 as measured by NOAA AVHRR
Sea surface temperature anomaly in the Pacific for September 1997 as measured by NOAA AVHRR
Sea surface temperature anomaly in the Pacific for October 1997 as measured by NOAA AVHRR
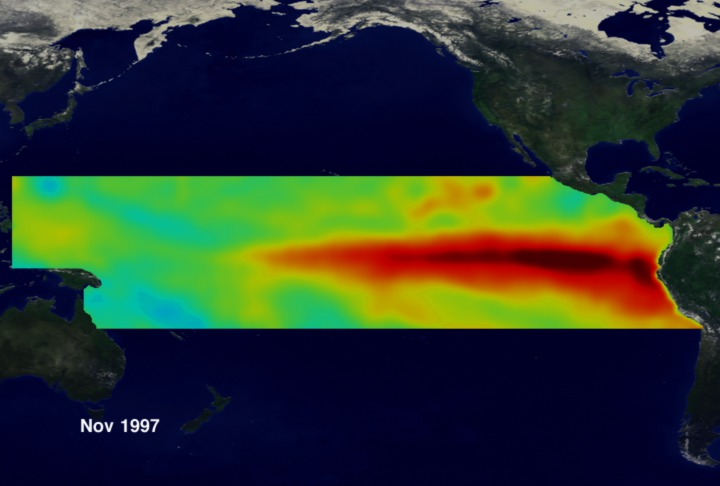
Sea surface temperature anomaly in the Pacific for November 1997 as measured by NOAA AVHRR
Sea surface temperature anomaly in the Pacific for December 1997 as measured by NOAA AVHRR
Sea surface temperature anomaly in the Pacific for January 1998 as measured by NOAA AVHRR
Sea surface temperature anomaly in the Pacific for February 1998 as measured by NOAA AVHRR
Sea surface temperature anomaly in the Pacific for March 1998 as measured by NOAA AVHRR
Sea surface temperature anomaly in the Pacific for April 1998 as measured by NOAA AVHRR
Sea surface temperature anomaly in the Pacific for May 1998 as measured by NOAA AVHRR
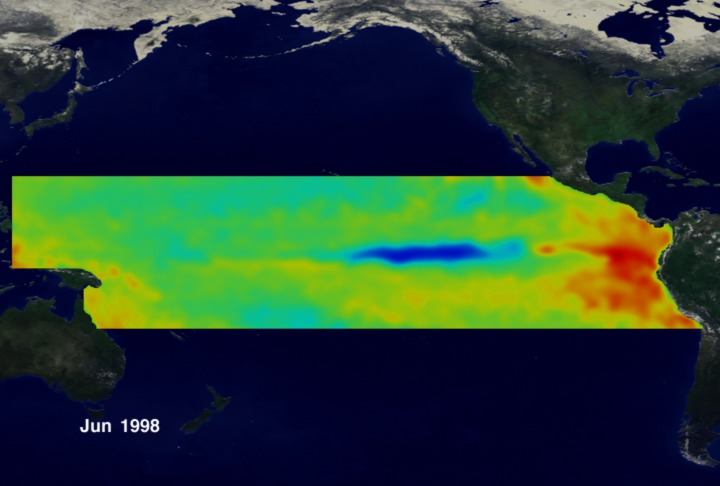
Sea surface temperature anomaly in the Pacific for June 1998 as measured by NOAA AVHRR
Video slate image reads "Monthly Sea Surface Temperature Anomaly Stills (various speeds) June 97 to June 1998".
Visualization Credits
Please give credit for this item to:
NASA/Goddard Space Flight Center Scientific Visualization Studio
NASA/Goddard Space Flight Center Scientific Visualization Studio
Short URL to share this page:
https://svs.gsfc.nasa.gov/206
Data Used:
Note: While we identify the data sets used in these visualizations, we do not store any further details nor the data sets themselves on our site.
Dates of Data Used:
1997/06/01-1998/06/30
This item is part of this series:
El Niño and La Niña
Keywords:
DLESE >> Physical oceanography
NASA Science >> Earth
https://svs.gsfc.nasa.gov/206
Data Used:
NOAA-14/AVHRR/NCEP Sea Surface Temperature Anomaly
1997/06/01-1998/06/30Dates of Data Used:
1997/06/01-1998/06/30
This item is part of this series:
El Niño and La Niña
Keywords:
DLESE >> Physical oceanography
NASA Science >> Earth


